TeeChart Java Demo
1.5star
137 reviews
10K+
Downloads

Everyone
info


About this app
Demo of the TeeChart charting and graphing Java library for Android.
Even if this demo application supports Android from v4.0.3 (API 15+), the TeeChart library supports Android from v2.1 (API 7+).
TeeChart is a tool for Android developers that adds charts to your Android application. TeeChart provides complete, quick and easy to use charting .NET, Java, ActiveX / COM, PHP and Delphi VCL controls for business, Real-time, Financial and Scientific applications.
This preview is intended to show some of the features that are available to developers. The Developer version is now available for evaluation at https://www.steema.com/downloads/java.
The release version of TeeChart for Android Charting component Library offers optional 100% sourcecode in Android Java (AWT/Swing and SWT formats are available too from Steema Software). It supports major Java programming environments including Eclipse, Sun NetBeans, IntelliJ IDEA and Oracle JDeveloper.
The charting library offers 50 Java Chart styles (in 2D and 3D plus multiple combinations), 38 mathematical functions and 20 Chart tools components for additional functionality including dragging of series marks, annotation objects, cursors and manual trend lines, coloring bands, etc.
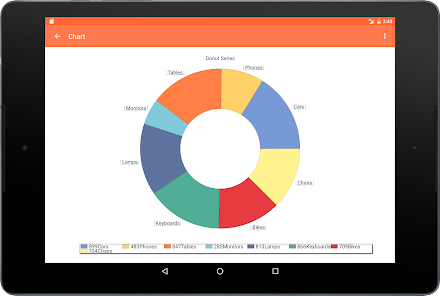
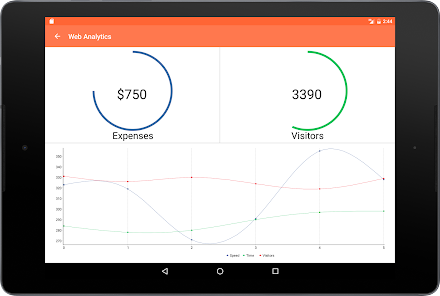
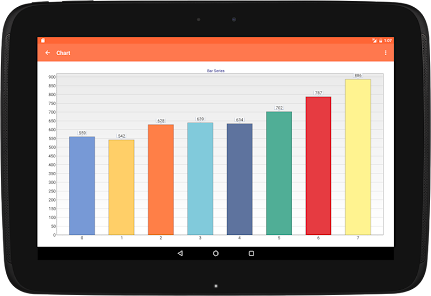
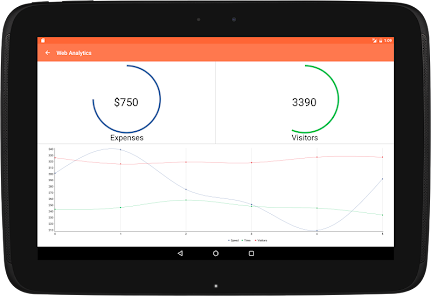
Charting styles:
Line (Tape), Points (Scatter XY and XYZ 3D Scatter), Area (Stacked and negative), FastLine (real-time speed), Horizontal Line, Bar and Horizontal Bar (Stacked and negative), Pie (Exploded, partial angle), Shape (Cube, Pyramid, Cylinder, etc), Arrow (Callout), Bubble, Gantt, Candle (Finantial OHLC High-Low), Donut (Exploded Doughnut), Volume (Stock), Bar 3D, Points 3D, Polar, Radar, Clock, WindRose, Pyramid, Surface (XYZ Grid Mesh), LinePoint, BarJoin.class, ColorGrid, Waterfall, Histogram, Error, ErrorBar, Contour (Contouring Levels), Smith, Calendar, HighLow, TriSurface (Voronoi triangulation of arbitrary XYZ points), Funnel, Box (Box Whisker), Horizontal Box, Horizontal Area, Tower, Point and Figure, Gauges, Vector 3D, Map (Mapping GIS), Bezier, Bar with Image, IsoSurface (Auto Leveled XYZ Mesh), Circular Gauge, Linear Gauge, Vertical Linear Gauge, Horizontal Histogram.
Feature Summary:
- 50 Chart styles (in 2D and 3D plus multiple combinations) including Gauges
- 38 mathematical functions
- 100% sourcecode for Android Java
- Run-time Editor, Gallery dialogs
- 20 Chart Tool components for additional functionality, like dragging series marks, annotation objects, cursors and manual trend lines, coloring bands, etc
- Multiple-axis support both horizontal and vertical
- Customisation of axis labels and legend items
- Great cosmetic properties for all texts and drawings
- Complete set of chart styles, both in 2D and 3D
- Live and animated zoom and scroll. Multi-touch and mouse wheel supported
- 2D and 3D
- Custom drawing canvas
- Extensive demos
- New improved Javadoc format help plus Tutorials
- Many new visual features, transparency, colour gradients, gray-scale.
Mathematical and statistical functions:
Add, Subtract, Multiply, Divide, High, Low, Average, Count, Momentum, Momentum Division, Cumulative, Exponential Average, Smoothing, Custom User Defined, Root Mean Square, Standard Deviation (StdDeviation), Stochastic, Exponential Moving Average, Performance, CrossPoints, Compress OHLC, CLV, OBV, CCI, Moving Average, PVO, DownSampling, Trend, Correlation, Variance, Perimeter, CurveFitting,ADX, Bollinger, MACD, SAR, RSI, Histogram Function.
Even if this demo application supports Android from v4.0.3 (API 15+), the TeeChart library supports Android from v2.1 (API 7+).
TeeChart is a tool for Android developers that adds charts to your Android application. TeeChart provides complete, quick and easy to use charting .NET, Java, ActiveX / COM, PHP and Delphi VCL controls for business, Real-time, Financial and Scientific applications.
This preview is intended to show some of the features that are available to developers. The Developer version is now available for evaluation at https://www.steema.com/downloads/java.
The release version of TeeChart for Android Charting component Library offers optional 100% sourcecode in Android Java (AWT/Swing and SWT formats are available too from Steema Software). It supports major Java programming environments including Eclipse, Sun NetBeans, IntelliJ IDEA and Oracle JDeveloper.
The charting library offers 50 Java Chart styles (in 2D and 3D plus multiple combinations), 38 mathematical functions and 20 Chart tools components for additional functionality including dragging of series marks, annotation objects, cursors and manual trend lines, coloring bands, etc.
Charting styles:
Line (Tape), Points (Scatter XY and XYZ 3D Scatter), Area (Stacked and negative), FastLine (real-time speed), Horizontal Line, Bar and Horizontal Bar (Stacked and negative), Pie (Exploded, partial angle), Shape (Cube, Pyramid, Cylinder, etc), Arrow (Callout), Bubble, Gantt, Candle (Finantial OHLC High-Low), Donut (Exploded Doughnut), Volume (Stock), Bar 3D, Points 3D, Polar, Radar, Clock, WindRose, Pyramid, Surface (XYZ Grid Mesh), LinePoint, BarJoin.class, ColorGrid, Waterfall, Histogram, Error, ErrorBar, Contour (Contouring Levels), Smith, Calendar, HighLow, TriSurface (Voronoi triangulation of arbitrary XYZ points), Funnel, Box (Box Whisker), Horizontal Box, Horizontal Area, Tower, Point and Figure, Gauges, Vector 3D, Map (Mapping GIS), Bezier, Bar with Image, IsoSurface (Auto Leveled XYZ Mesh), Circular Gauge, Linear Gauge, Vertical Linear Gauge, Horizontal Histogram.
Feature Summary:
- 50 Chart styles (in 2D and 3D plus multiple combinations) including Gauges
- 38 mathematical functions
- 100% sourcecode for Android Java
- Run-time Editor, Gallery dialogs
- 20 Chart Tool components for additional functionality, like dragging series marks, annotation objects, cursors and manual trend lines, coloring bands, etc
- Multiple-axis support both horizontal and vertical
- Customisation of axis labels and legend items
- Great cosmetic properties for all texts and drawings
- Complete set of chart styles, both in 2D and 3D
- Live and animated zoom and scroll. Multi-touch and mouse wheel supported
- 2D and 3D
- Custom drawing canvas
- Extensive demos
- New improved Javadoc format help plus Tutorials
- Many new visual features, transparency, colour gradients, gray-scale.
Mathematical and statistical functions:
Add, Subtract, Multiply, Divide, High, Low, Average, Count, Momentum, Momentum Division, Cumulative, Exponential Average, Smoothing, Custom User Defined, Root Mean Square, Standard Deviation (StdDeviation), Stochastic, Exponential Moving Average, Performance, CrossPoints, Compress OHLC, CLV, OBV, CCI, Moving Average, PVO, DownSampling, Trend, Correlation, Variance, Perimeter, CurveFitting,ADX, Bollinger, MACD, SAR, RSI, Histogram Function.
Updated on
Safety starts with understanding how developers collect and share your data. Data privacy and security practices may vary based on your use, region, and age. The developer provided this information and may update it over time.

No data shared with third parties
Learn more about how developers declare sharing

No data collected
Learn more about how developers declare collection
Ratings and reviews
1.0
126 reviews

A Google user
- Flag inappropriate
February 5, 2014
2 people found this review helpful
A Google user
- Flag inappropriate
July 22, 2012
Demoz r gud to see but ve dnt ve any acess to input save nd view our database.....dats makes it uzeless.... am keeping it in my tab jus to monitor da battery status in de analog styl and to view mine nd nebrng netwrks strength..... dats it..... single star iz fine for da usage allowed nd given free..... rashid khan isb pakistan...
2 people found this review helpful
A Google user
- Flag inappropriate
July 26, 2011
Settings tables are white on white. Cant see text without touching cell
5 people found this review helpful
What's new
- Gauges demos now have movement


