
ProfiSignal 20
50+
Preuzimanja

Svako
info


O aplikaciji
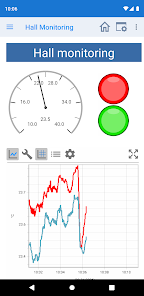
ProfiSignal 20 is a platform independent software for measurement data analysis and process monitoring. Using the ProfiSignal 20 App you can visualize and analyze your measurement data and monitor and control your processes regardless of your location.
Key Features:
• Measurement data monitoring and analysis from different sources (hardware and software)
• From measurement data to a chart visualization in only three steps using ProfiSignal Go
• System and process visualization without any programming effort using ProfiSignal Basic
• The Innovative SCACH-Feature opens your charts and projects via a simple QR-code scan
• y(t)-diagrams with one or multiple axes for simultaneous visualization and analysis of different measurement values
• Analyze multiple measurement curves sharing a single time axis using the Multitrack Chart
• Powerful visualization of measurement data with fast, seamless transition between live and historical data
• A wide range of displays and controls for creating individual process dashboards
• Adjust your projects while in runtime using the working copy concept
• Design and reuse frequently used object combinations with the Object Designer
Ažurirano dana
Sigurnost počinje razumijevanjem na koji način programeri prikupljaju i dijele vaše podatke. Privatnost podataka i sigurnosne prakse se mogu razlikovati ovisno o korištenju, regiji i dobi. Programer je naveo ove informacije i može ih s vremenom ažurirati.

Podaci se ne dijele s trećim stranama
Saznajte više o načinu na koji programeri pružaju izjavu o dijeljenju

Ova aplikacija može prikupljati ove vrste podataka
Lične informacije, Fotografije i videozapisi i još 4

Podaci nisu šifrirani
Podaci se ne mogu izbrisati
Što je novo
- It is now possible to use video feeds in Basic projects.
- We have introduced autoscaling of the relative time axis in charts.
- A button has been added to the chart toolbar to reload chart data.
- The project title is now automatically used as the chart headline.
- All project channels are now added to the temporary storage.
- The logic chart has been added to the list of charts.
- Bug fixes and various other improvements.
Podrška za aplikaciju
Informacije o programeru
Delphin Technology AG
info@delphin.de
Lustheide 81
51427 Bergisch Gladbach
Germany
+49 160 96696110


