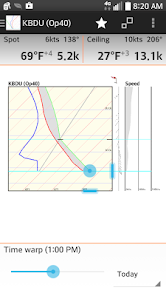
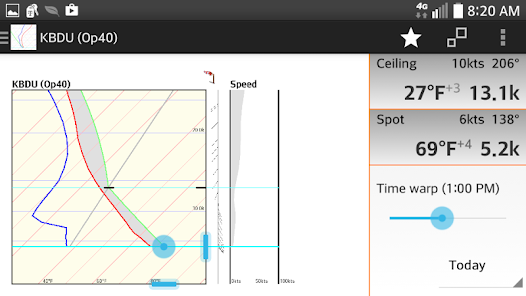
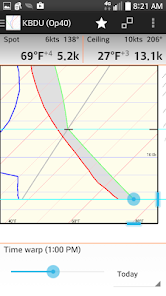
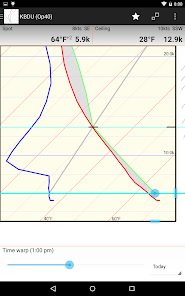
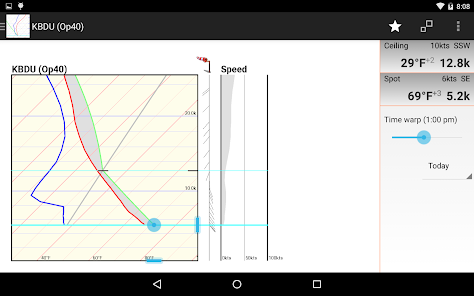
Skew-T Log-P diagrams are commonly used for weather analysis and forecasting. They graph weather balloon data to show the vertical profile of the temperature and dew point through the atmosphere.
See the following Finger Lakes Soaring Club web link for a great article describing how glider pilots use skew-t graphs to predict weather for a days flight. http://www.flsc.org/portals/12/PDF/Read_Skew_T.pdf
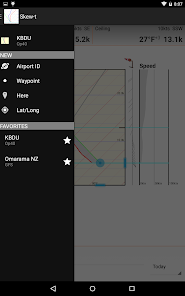
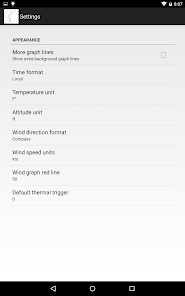
Features: Uses data from http://rucsoundings.noaa.gov/ Automatically download the day's weather data Use the slider to quickly view all hour-by-hour graphs. Zoom to inspect the graph details Configurable units and graph lines Use different weather models Show forecast graphs for the next few days Saved favorites to quickly view different locations and/or weather models. Here mode uses GPS to easily get graphs for your current location. Load waypoints from files.
Updated on
Mar 25, 2024
Weather
Data safety
arrow_forward
Safety starts with understanding how developers collect and share your data. Data privacy and security practices may vary based on your use, region, and age. The developer provided this information and may update it over time.