
xGraphing - function grapher
Contains ads
3.8star
697 reviews
50K+
Downloads

Everyone
info
About this app
Graphing mathemathical functions have never been so easy before!
xGraphing app makes creating mathematical graphs easy and intuitive!
Support for small and large (phone and tablet) devices!
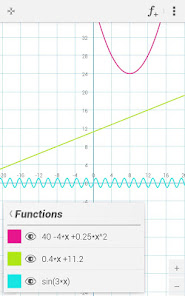
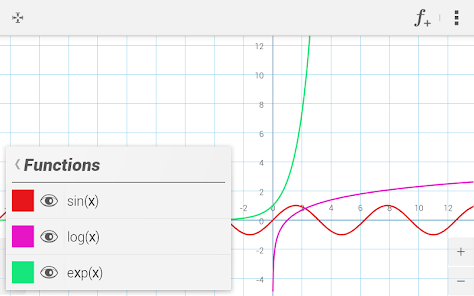
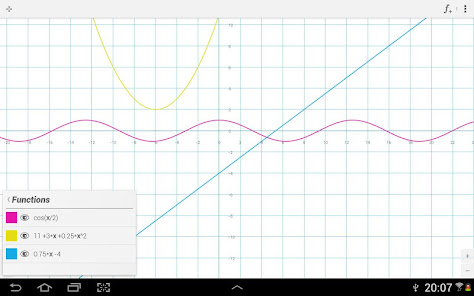
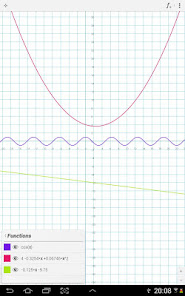
1) Plotting mathematical functions with given equation is the basis.
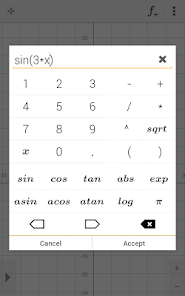
Application offers all most popular mathematical functions and operators like:
•• math functions, sinus, cosinus, tangens, absolute value, exponential function, arcus sinus, arcus cosinus, arcus tangens, logarithm and square root
•• math operators: addition, substraction, multiplication, division, exponentiation
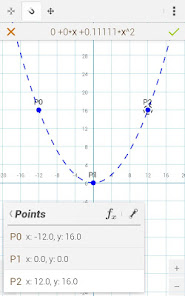
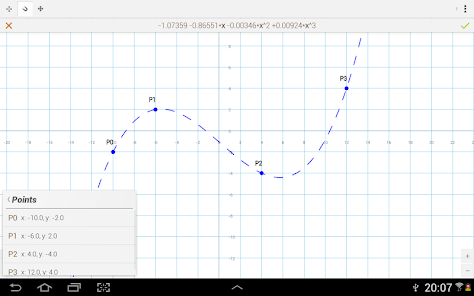
2) Besides standard method, also the new useful method exists!:
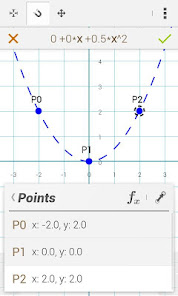
•• Creating function graphs and calculating equations from points specified by user!
•• After user will give chosen points on screen he recieves function graph with equation - Just tap some points on the screen and admire a splendid function graph with equation!!
•• Up to 4 points are supported!
3) The whole is completed by additional functions and splendid user interface:
•• moving/zooming visible coordinate system area with pan/pinch gestures
•• interactive functions list which allows to select, edit, translate by vector or just delete function
•• visible coordinate system area settings window
4) Additional functions:
•• Sharing visible coordinate system sector
•• Saving coordinate system to file
5) The modern tutorial showing all base application functions!
xGraphing app makes creating mathematical graphs easy and intuitive!
Support for small and large (phone and tablet) devices!
1) Plotting mathematical functions with given equation is the basis.
Application offers all most popular mathematical functions and operators like:
•• math functions, sinus, cosinus, tangens, absolute value, exponential function, arcus sinus, arcus cosinus, arcus tangens, logarithm and square root
•• math operators: addition, substraction, multiplication, division, exponentiation
2) Besides standard method, also the new useful method exists!:
•• Creating function graphs and calculating equations from points specified by user!
•• After user will give chosen points on screen he recieves function graph with equation - Just tap some points on the screen and admire a splendid function graph with equation!!
•• Up to 4 points are supported!
3) The whole is completed by additional functions and splendid user interface:
•• moving/zooming visible coordinate system area with pan/pinch gestures
•• interactive functions list which allows to select, edit, translate by vector or just delete function
•• visible coordinate system area settings window
4) Additional functions:
•• Sharing visible coordinate system sector
•• Saving coordinate system to file
5) The modern tutorial showing all base application functions!
Updated on
Data safety
Developers can show information here about how their app collects and uses your data. Learn more about data safety

No information available
Ratings and reviews
3.6
633 reviews

Pritam Kumar Rana
- Flag inappropriate
January 7, 2022
Easy to use and graph window is large enough
3 people found this review helpful

Chris Nash (Intrepidis)
- Flag inappropriate
December 9, 2023
It can even calculate a formula based on manually plotted points on the graph. Absolutely amazing! Better than I expected! And yes, it IS possible to type precise values for plotted vectors!!!
2 people found this review helpful

A Google user
- Flag inappropriate
May 11, 2014
Can only add points by clicking the graph instead of just writing then in. After you start adding points you also cannot scale the graph any more.
12 people found this review helpful