
Graphical Analysis
১.৯star
৩৭৭ টা পৰ্যালোচনা

সকলো
info
১ লাখ+
ডাউনল’ড

সকলো
অধিক জানক


এই এপ্টোৰ বিষয়ে
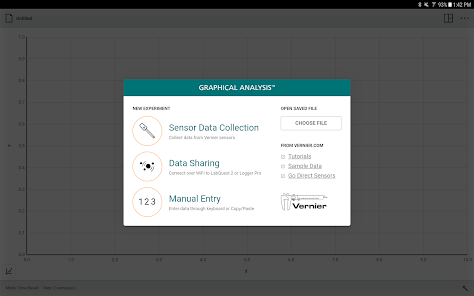
Graphical Analysis™ is a tool for science students to collect, graph, and analyze data from Vernier sensors.
Sensor data-collection support:
• Vernier Go Direct® sensors - with Bluetooth® wireless technology
• Vernier Go Wireless® Heart Rate and Go Wireless Exercise Heart Rate monitors
Additional experiment options:
• Data Sharing via Wi-Fi connection to LabQuest 2, LabQuest 3 or Logger Pro® 3
• Manual Entry
Note: Sensor data collection and Data Sharing require the purchase of hardware from Vernier Software & Technology. Manual entry of data can be performed without a hardware purchase. For more information on Data Sharing, visit http://www.vernier.com/css
Key Features - Data Collection
• Multi-sensor data-collection support
• Time Based, Event Based, and Drop Counting data-collection modes
• Configurable data-collection rate and duration for time-based data collection
• Optional triggering of time-based data collection based on sensor value
• Customizable unit display on supported sensors
• Sensor calibrations
• Option to zero and reverse sensor readings
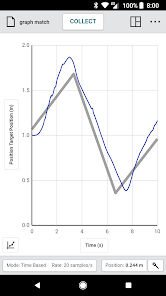
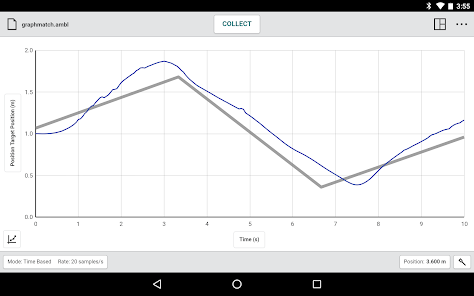
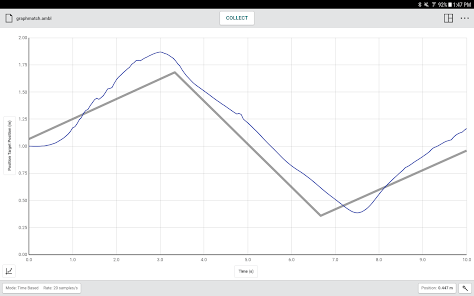
• Graph match feature for use with motion detectors
• Manual entry of data from keyboard and clipboard
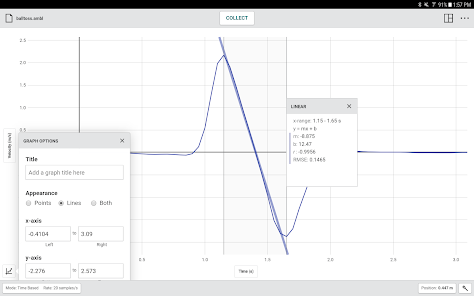
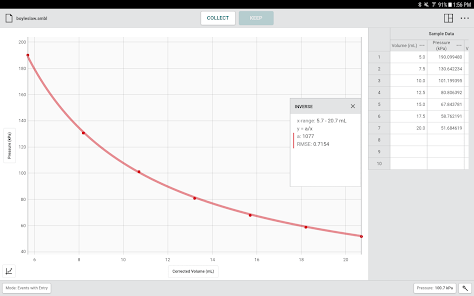
Key Features - Data Analysis
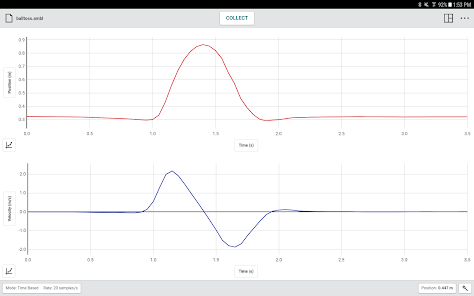
• Display one, two, or three graphs simultaneously
• View data in a table or show a graph and table side-by-side
• Draw Predictions on a graph to uncover misconceptions
• Examine, interpolate/extrapolate, and select data
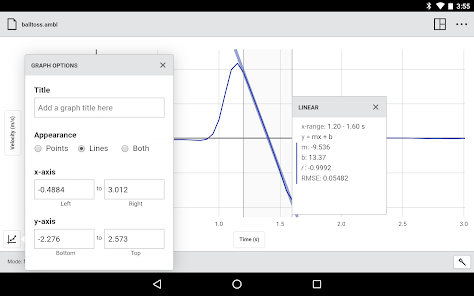
• Use Tangent tool to show instantaneous rates of change of the data
• Find area under a curve using the Integral tool
• Apply Statistics calculations to find mean, min, max, and standard deviation
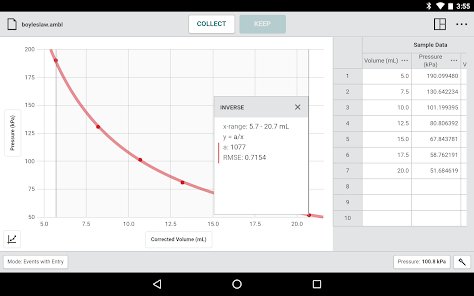
• Perform curve fits, including linear, quadratic, natural exponent, and more
• Add calculated columns based on existing data to linearize data or investigate related concepts
Key Features - Collaboration and Sharing
• Create text annotations and add graph titles
• Export graphs and data for printing and inclusion in lab reports
• Save files (.ambl file format) to the Cloud for exchange with Graphical Analysis on other Android™ devices, Chromebooks™, Windows® and macOS® computers, and iOS devices
• Export data in .CSV format for analysis of data in spreadsheet software such as Excel, Google Sheets, and Numbers
• Adjust font sizes for easier viewing when presenting to your class
Vernier Software & Technology has over 35 years of experience in providing effective learning resources for understanding experimental data in science and math classrooms. Graphical Analysis is a part of the extensive system of sensors, interfaces, and data-collection software from Vernier for science and STEM education.
Sensor data-collection support:
• Vernier Go Direct® sensors - with Bluetooth® wireless technology
• Vernier Go Wireless® Heart Rate and Go Wireless Exercise Heart Rate monitors
Additional experiment options:
• Data Sharing via Wi-Fi connection to LabQuest 2, LabQuest 3 or Logger Pro® 3
• Manual Entry
Note: Sensor data collection and Data Sharing require the purchase of hardware from Vernier Software & Technology. Manual entry of data can be performed without a hardware purchase. For more information on Data Sharing, visit http://www.vernier.com/css
Key Features - Data Collection
• Multi-sensor data-collection support
• Time Based, Event Based, and Drop Counting data-collection modes
• Configurable data-collection rate and duration for time-based data collection
• Optional triggering of time-based data collection based on sensor value
• Customizable unit display on supported sensors
• Sensor calibrations
• Option to zero and reverse sensor readings
• Graph match feature for use with motion detectors
• Manual entry of data from keyboard and clipboard
Key Features - Data Analysis
• Display one, two, or three graphs simultaneously
• View data in a table or show a graph and table side-by-side
• Draw Predictions on a graph to uncover misconceptions
• Examine, interpolate/extrapolate, and select data
• Use Tangent tool to show instantaneous rates of change of the data
• Find area under a curve using the Integral tool
• Apply Statistics calculations to find mean, min, max, and standard deviation
• Perform curve fits, including linear, quadratic, natural exponent, and more
• Add calculated columns based on existing data to linearize data or investigate related concepts
Key Features - Collaboration and Sharing
• Create text annotations and add graph titles
• Export graphs and data for printing and inclusion in lab reports
• Save files (.ambl file format) to the Cloud for exchange with Graphical Analysis on other Android™ devices, Chromebooks™, Windows® and macOS® computers, and iOS devices
• Export data in .CSV format for analysis of data in spreadsheet software such as Excel, Google Sheets, and Numbers
• Adjust font sizes for easier viewing when presenting to your class
Vernier Software & Technology has over 35 years of experience in providing effective learning resources for understanding experimental data in science and math classrooms. Graphical Analysis is a part of the extensive system of sensors, interfaces, and data-collection software from Vernier for science and STEM education.
আপডে’ট কৰা তাৰিখ
বিকাশকৰ্তাসকলে আপোনাৰ ডেটা কেনেকৈ সংগ্ৰহ আৰু শ্বেয়াৰ কৰে সেয়া বুজি পোৱাৰ জৰিয়তে সুৰক্ষা আৰম্ভ হয়। ডেটাৰ গোপনীয়তা আৰু সুৰক্ষা প্ৰণালী আপোনাৰ ব্যৱহাৰ, অঞ্চল আৰু বয়সৰ ওপৰত ভিত্তি কৰি ভিন্ন হ’ব পাৰে। বিকাশকৰ্তাগৰাকীয়ে এই তথ্যখিনি প্ৰদান কৰিছে আৰু সময়ৰ লগে লগে এয়া আপডে’ট কৰিব পাৰে।

তৃতীয় পক্ষৰ সৈতে কোনো ডেটা শ্বেয়াৰ কৰা নাই
বিকাশকৰ্তাই ডেটা শ্বেয়াৰ কৰাৰ বিষয়ে কেনেকৈ ঘোষণা কৰে সেই বিষয়ে অধিক জানক

এই এপ্টোৱে এই ধৰণৰ ডেটা সংগ্ৰহ কৰিব পাৰে
অৱস্থান আৰু এপৰ কাৰ্যকলাপ

ডেটা ট্ৰেনজিটত এনক্ৰিপ্ট কৰা হয়

ডেটা মচিব নোৱাৰি
মূল্যাংকন আৰু পৰ্যালোচনাসমূহ
২.০
৩৩৭ টা পৰ্যালোচনা
নতুন কি আছে
• [NEW] Troubleshooting tips now appear when a Go Direct connection fails
• [NEW] All available firmware updates are listed in device info
• [FIX] Improved performance when exporting to PDF with notes enabled
• [FIX] Fixed unresponsive UI elements during the product tour
• [NEW] All available firmware updates are listed in device info
• [FIX] Improved performance when exporting to PDF with notes enabled
• [FIX] Fixed unresponsive UI elements during the product tour
সকলো
অধিক জানকএপৰ সমৰ্থন
phone
ফ'ন নম্বৰ
+18888376437
বিকাশকৰ্তাৰ বিষয়ে
VERNIER SOFTWARE & TECHNOLOGY LLC
swmgr@vernier.com
13979 SW Millikan Way
Beaverton, OR 97005
United States
+1 503-730-8704


