
Graphical Analysis
1.9star
378 reviews

Everyone
info
100K+
Downloads

Everyone
Learn more


About this app
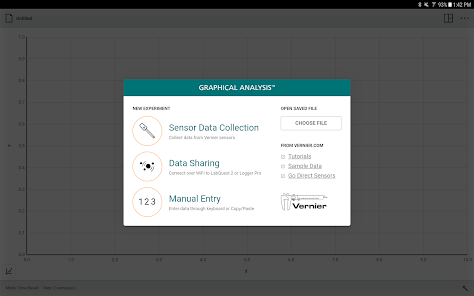
Graphical Analysis™ is a tool for science students to collect, graph, and analyze data from Vernier sensors.
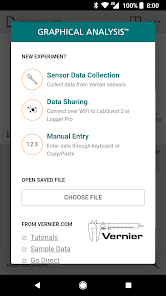
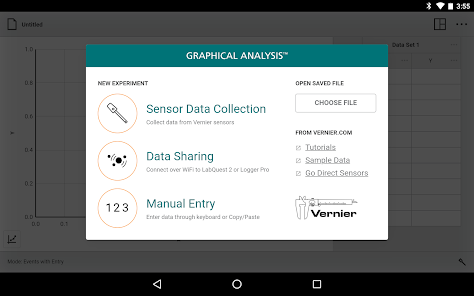
Sensor data-collection support:
• Vernier Go Direct® sensors - with Bluetooth® wireless technology
• Vernier Go Wireless® Heart Rate and Go Wireless Exercise Heart Rate monitors
Additional experiment options:
• Data Sharing via Wi-Fi connection to LabQuest 2, LabQuest 3 or Logger Pro® 3
• Manual Entry
Note: Sensor data collection and Data Sharing require the purchase of hardware from Vernier Software & Technology. Manual entry of data can be performed without a hardware purchase. For more information on Data Sharing, visit http://www.vernier.com/css
Key Features - Data Collection
• Multi-sensor data-collection support
• Time Based, Event Based, and Drop Counting data-collection modes
• Configurable data-collection rate and duration for time-based data collection
• Optional triggering of time-based data collection based on sensor value
• Customizable unit display on supported sensors
• Sensor calibrations
• Option to zero and reverse sensor readings
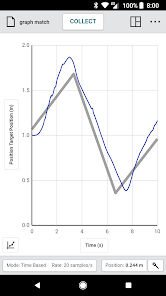
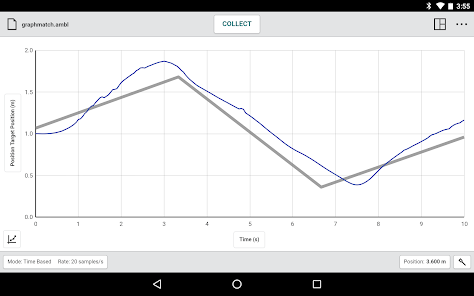
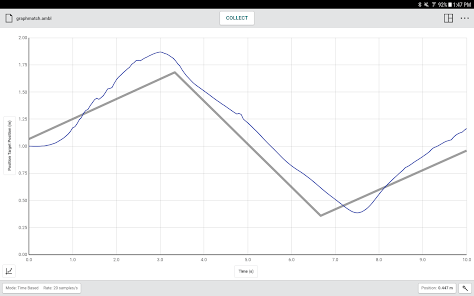
• Graph match feature for use with motion detectors
• Manual entry of data from keyboard and clipboard
Key Features - Data Analysis
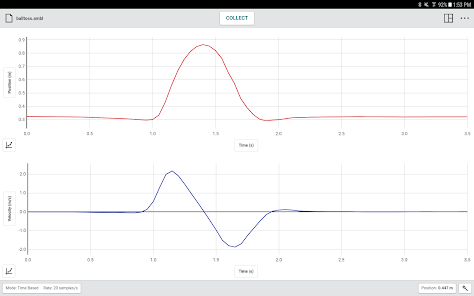
• Display one, two, or three graphs simultaneously
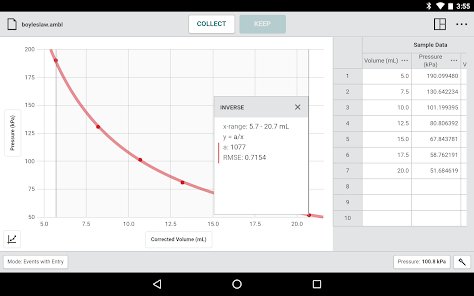
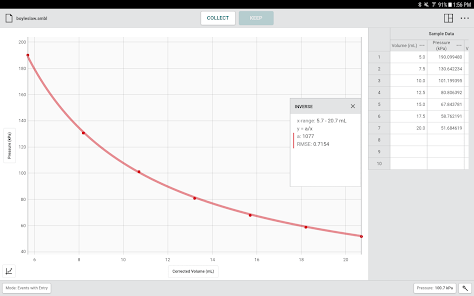
• View data in a table or show a graph and table side-by-side
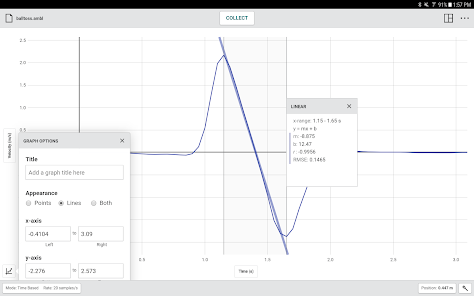
• Draw Predictions on a graph to uncover misconceptions
• Examine, interpolate/extrapolate, and select data
• Use Tangent tool to show instantaneous rates of change of the data
• Find area under a curve using the Integral tool
• Apply Statistics calculations to find mean, min, max, and standard deviation
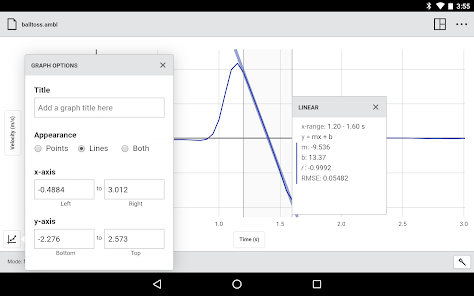
• Perform curve fits, including linear, quadratic, natural exponent, and more
• Add calculated columns based on existing data to linearize data or investigate related concepts
Key Features - Collaboration and Sharing
• Create text annotations and add graph titles
• Export graphs and data for printing and inclusion in lab reports
• Save files (.ambl file format) to the Cloud for exchange with Graphical Analysis on other Android™ devices, Chromebooks™, Windows® and macOS® computers, and iOS devices
• Export data in .CSV format for analysis of data in spreadsheet software such as Excel, Google Sheets, and Numbers
• Adjust font sizes for easier viewing when presenting to your class
Vernier Software & Technology has over 35 years of experience in providing effective learning resources for understanding experimental data in science and math classrooms. Graphical Analysis is a part of the extensive system of sensors, interfaces, and data-collection software from Vernier for science and STEM education.
Sensor data-collection support:
• Vernier Go Direct® sensors - with Bluetooth® wireless technology
• Vernier Go Wireless® Heart Rate and Go Wireless Exercise Heart Rate monitors
Additional experiment options:
• Data Sharing via Wi-Fi connection to LabQuest 2, LabQuest 3 or Logger Pro® 3
• Manual Entry
Note: Sensor data collection and Data Sharing require the purchase of hardware from Vernier Software & Technology. Manual entry of data can be performed without a hardware purchase. For more information on Data Sharing, visit http://www.vernier.com/css
Key Features - Data Collection
• Multi-sensor data-collection support
• Time Based, Event Based, and Drop Counting data-collection modes
• Configurable data-collection rate and duration for time-based data collection
• Optional triggering of time-based data collection based on sensor value
• Customizable unit display on supported sensors
• Sensor calibrations
• Option to zero and reverse sensor readings
• Graph match feature for use with motion detectors
• Manual entry of data from keyboard and clipboard
Key Features - Data Analysis
• Display one, two, or three graphs simultaneously
• View data in a table or show a graph and table side-by-side
• Draw Predictions on a graph to uncover misconceptions
• Examine, interpolate/extrapolate, and select data
• Use Tangent tool to show instantaneous rates of change of the data
• Find area under a curve using the Integral tool
• Apply Statistics calculations to find mean, min, max, and standard deviation
• Perform curve fits, including linear, quadratic, natural exponent, and more
• Add calculated columns based on existing data to linearize data or investigate related concepts
Key Features - Collaboration and Sharing
• Create text annotations and add graph titles
• Export graphs and data for printing and inclusion in lab reports
• Save files (.ambl file format) to the Cloud for exchange with Graphical Analysis on other Android™ devices, Chromebooks™, Windows® and macOS® computers, and iOS devices
• Export data in .CSV format for analysis of data in spreadsheet software such as Excel, Google Sheets, and Numbers
• Adjust font sizes for easier viewing when presenting to your class
Vernier Software & Technology has over 35 years of experience in providing effective learning resources for understanding experimental data in science and math classrooms. Graphical Analysis is a part of the extensive system of sensors, interfaces, and data-collection software from Vernier for science and STEM education.
Updated on
Safety starts with understanding how developers collect and share your data. Data privacy and security practices may vary based on your use, region, and age. The developer provided this information and may update it over time.

No data shared with third parties
Learn more about how developers declare sharing

This app may collect these data types
Location and App activity

Data is encrypted in transit

Data can’t be deleted
Ratings and reviews
2.0
338 reviews

Ian
- Flag inappropriate
September 13, 2023
(Used on different device, installed here to rate) This app is the worst. My Chem teacher makes me use it and it is the LEAST user friendly app I've seen. It's simple to add points, but as soon as you want to rename the title, x axis, or y axis it is impossible to find. The user manual does not help, the buttons it wants me to click are non-existent. When you go to export it, it limits you to one type of file, which, in the end, DOES NOT PRINT. Horrible app.
26 people found this review helpful
Vernier Science Education
October 3, 2023
We're so sorry you have had difficulty using our app. We're happy to help you navigate our tools. Contact us at https://www.vernier.com/support/.

Atom Bomb
- Flag inappropriate
June 11, 2020
The problem with this app is that everything is hard to organize, hard to input data, and yes my teacher had me get this. So this is even worse because I have to desperately move things around to try and get a good screenshot, when I should be able to just zoom out from the start so I can provide the evidence I need in my work. The creators really need to make it easier to input data freely and organize their boxes better. I can't even make a line of fit without it taking up 3/4 of the screen.
69 people found this review helpful
Vernier Science Education
June 11, 2020
Hello, thanks for your detailed explanation of the issues you're experiencing. We feel the same about the into boxes being in the way and data input being hard. We have plans to fix these issues to provide a better user experience. Obviously that doesn't help you today, and for that we're extremely sorry for the trouble this causes.

Thomas A
- Flag inappropriate
February 25, 2021
The app works great for the most part. However, there were some issues detecting Bluetooth sensors (GoDirect Acceleration Sensor). My other major complaint lies within the data exportation function. I was exporting collected data to a csv file. The process would show was complete and the file would be present but none of the data would be written. This happened 8/10 times. With no feedback, this was incredibly frustrating when I went to do analysis on the data collected. Besides that, good job.
72 people found this review helpful
What’s new
• [NEW] Troubleshooting tips now appear when a Go Direct connection fails
• [NEW] All available firmware updates are listed in device info
• [FIX] Improved performance when exporting to PDF with notes enabled
• [FIX] Fixed unresponsive UI elements during the product tour
• [NEW] All available firmware updates are listed in device info
• [FIX] Improved performance when exporting to PDF with notes enabled
• [FIX] Fixed unresponsive UI elements during the product tour
Everyone
Learn moreApp support
phone
Phone number
+18888376437
About the developer
VERNIER SOFTWARE & TECHNOLOGY LLC
swmgr@vernier.com
13979 SW Millikan Way
Beaverton, OR 97005
United States
+1 503-730-8704


