

Lab Plot n Fit

4,1star
27 avis
500+
Téléchargements

Tout public
info


À propos de l'application
Are you a student pursuing a course in science or engineering? Do you have a hard time recording and analyzing all the data in your lab or practical class? Wouldn't it be great if you could make the smart phone in your pocket record, plot and analyze the data for you instead?
'Lab Plot n Fit' does just that and more. The android app can not only help you draw graphs of single and multi-set 2-dimensional numeric as well as time-series X-Y data with ease, but can also help you fit the data to a number of commonly encountered mathematical functions and also to any user defined function as well. You can then analyze the data just as you would do in the lab, without however having to use a graph paper or a computer and even without having to connect to the Internet.
With the 'Lab Plot n Fit' you can do a whole lot of things like:
* Enter your lab data row-wise or alternatively read in your entire data from a text data file (.txt, .dat or .csv) generated from MS Excel or other software programs and stored in your device's memory beforehand.
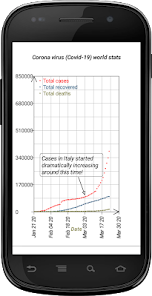
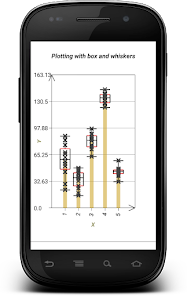
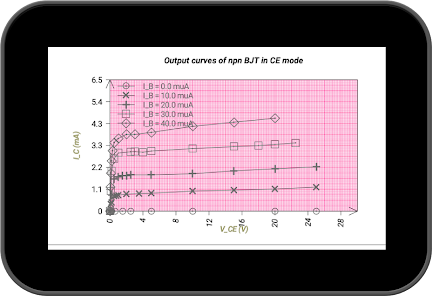
* Plot graphs of one or more number of data-sets by using a simple interface. Generate grids of different resolutions mimicking a conventional graph paper.
* Change axes ranges, change axes types, stretch or shrink the axes or shift the origin.
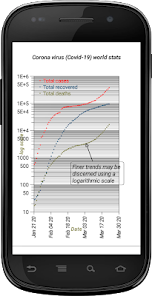
* Scale your axes to generate semi-log and even log-log graphs.
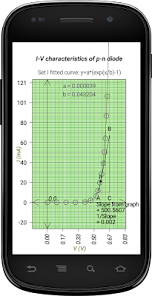
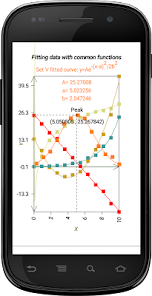
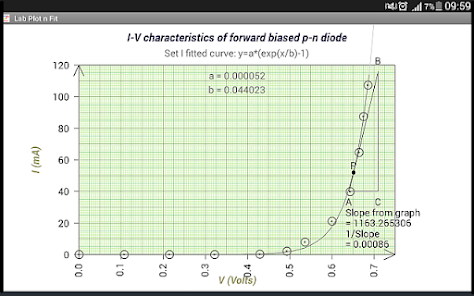
* Fit the whole or a portion of the graph for each data set to common mathematical functions and also to any user defined function , also using a simple interface.
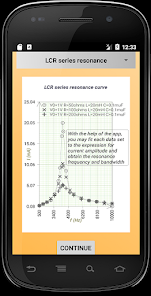
* Once the plotting and fitting is done, double tap on any point on the fitted curve to observe and display the corresponding X-Y point. Perform a slope calculation at that point by drawing a tangent and a right-angled triangle, just as you would do using a conventional graph paper. Also obtain Y value(s) at any X value and X value(s) at any Y value from the fitted curve.
* Save both the data as well as high resolution images of your displayed graph, both before and after fitting, to the device's memory.
* Retrieve the saved data at a later time by importing the saved data file into the app and then edit, plot and fit the data again.
* Add info like, your name, instructor's or teaching assistant's name, the name of the experiment the graph pertains to, and so on, to your graph image and data and send them as part of your lab assignment to your teacher or supervisor via email or WhatsApp, from right inside the app itself.
*And text and arrow annotations.
*And more.
Thanking you all,
Authors: A. Poddar and M. Poddar
abhidipt@hotmail.com
'Lab Plot n Fit' does just that and more. The android app can not only help you draw graphs of single and multi-set 2-dimensional numeric as well as time-series X-Y data with ease, but can also help you fit the data to a number of commonly encountered mathematical functions and also to any user defined function as well. You can then analyze the data just as you would do in the lab, without however having to use a graph paper or a computer and even without having to connect to the Internet.
With the 'Lab Plot n Fit' you can do a whole lot of things like:
* Enter your lab data row-wise or alternatively read in your entire data from a text data file (.txt, .dat or .csv) generated from MS Excel or other software programs and stored in your device's memory beforehand.
* Plot graphs of one or more number of data-sets by using a simple interface. Generate grids of different resolutions mimicking a conventional graph paper.
* Change axes ranges, change axes types, stretch or shrink the axes or shift the origin.
* Scale your axes to generate semi-log and even log-log graphs.
* Fit the whole or a portion of the graph for each data set to common mathematical functions and also to any user defined function , also using a simple interface.
* Once the plotting and fitting is done, double tap on any point on the fitted curve to observe and display the corresponding X-Y point. Perform a slope calculation at that point by drawing a tangent and a right-angled triangle, just as you would do using a conventional graph paper. Also obtain Y value(s) at any X value and X value(s) at any Y value from the fitted curve.
* Save both the data as well as high resolution images of your displayed graph, both before and after fitting, to the device's memory.
* Retrieve the saved data at a later time by importing the saved data file into the app and then edit, plot and fit the data again.
* Add info like, your name, instructor's or teaching assistant's name, the name of the experiment the graph pertains to, and so on, to your graph image and data and send them as part of your lab assignment to your teacher or supervisor via email or WhatsApp, from right inside the app itself.
*And text and arrow annotations.
*And more.
Thanking you all,
Authors: A. Poddar and M. Poddar
abhidipt@hotmail.com
Date de mise à jour
La sécurité, c'est d'abord comprendre comment les développeurs collectent et partagent vos données. Les pratiques concernant leur confidentialité et leur protection peuvent varier selon votre utilisation, votre région et votre âge. Le développeur a fourni ces informations et peut les modifier ultérieurement.

Aucune donnée partagée avec des tiers
En savoir plus sur la manière dont les développeurs déclarent le partage

Aucune donnée collectée
En savoir plus sur la manière dont les développeurs déclarent la collecte
Notes et avis
4,2
21 avis
Nouveautés
* App has now been made compatible with all new android versions.
* New user-interface has been used to import data from a file.
* New user-interface has been used to export data and graphs to files.
* Important bug fixes.
* The app has now been made available in English, German, Spanish, Portuguese, French, Bengali and Hindi.
* New user-interface has been used to import data from a file.
* New user-interface has been used to export data and graphs to files.
* Important bug fixes.
* The app has now been made available in English, German, Spanish, Portuguese, French, Bengali and Hindi.
Assistance de l'appli
À propos du développeur
Abhijit Poddar
monsar123@gmail.com
BE 269 Sector 1
Salt Lake
Kolkata India, West Bengal 700064
India
undefined


