血圧レコーダー - 血圧測定結果記録アプリ
Contains ads
10K+
Downloads

Everyone
info


About this app
■ Features of the app
・Simple design, easy to see and use
・Easy to use without account registration
・According to multiple measurements per day, the results can be recorded quickly.
・You can also record the measurement time, and you can know the trend of blood pressure for each situation.
・Aggregate the frequency of high blood pressure and use it for health management
・You can compare the measurement results of the two periods in a graph and understand the transition
・Graphs and lists can be output to PDF and saved as a report
・Can be backed up in CSV, and can import CSV files edited on a PC
・You can also record your weight and manage your health more comprehensively.
・All functions are available for free
■ Recommended for these people
・People who want to manage their blood pressure notes on their smartphones
・ People who want to quickly record results and manage their health
・ People who want to measure many times a day, such as morning and night
・People who want to know the trend of blood pressure for each situation, such as when taking medicine or after bathing.
・People who want to understand trends in graphs
・ People who want to compare blood pressure before and after lifestyle improvement
■ Various functions
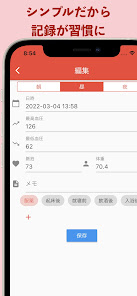
·record
Since the recording screen is displayed after the application starts, you can record quickly.
In addition to systolic blood pressure, diastolic blood pressure, and pulse, it also
Freely customizable tag information can also be recorded together.
From the setting screen, you can enable the input of weight and measurement time.
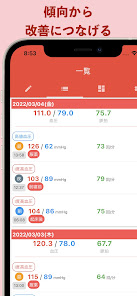
・List
Measurement results can be displayed in an easy-to-read list format.
If you measure multiple times in one day, the average value is also displayed.
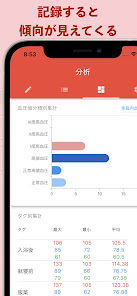
·analysis
In addition to graph display of systolic blood pressure, diastolic blood pressure, and pulse
You can also display a graph summarizing the degree and frequency of hypertension and the summary results by tag.
Also, by tapping the arrow button on the upper right of the graph, you can transition to the screen where the measurement results of the two periods are compared graphically.
・Report
Changes in daily average values and a list can be output in PDF format.
Please use it for documents to be submitted to doctors.
·setting
You can set input items and customize tags.
In addition, CSV backup of measurement results and CSV files edited on a PC can be imported.
■ Request
If you have any features or bugs that you would like to see added, please feel free to leave a review!
・Simple design, easy to see and use
・Easy to use without account registration
・According to multiple measurements per day, the results can be recorded quickly.
・You can also record the measurement time, and you can know the trend of blood pressure for each situation.
・Aggregate the frequency of high blood pressure and use it for health management
・You can compare the measurement results of the two periods in a graph and understand the transition
・Graphs and lists can be output to PDF and saved as a report
・Can be backed up in CSV, and can import CSV files edited on a PC
・You can also record your weight and manage your health more comprehensively.
・All functions are available for free
■ Recommended for these people
・People who want to manage their blood pressure notes on their smartphones
・ People who want to quickly record results and manage their health
・ People who want to measure many times a day, such as morning and night
・People who want to know the trend of blood pressure for each situation, such as when taking medicine or after bathing.
・People who want to understand trends in graphs
・ People who want to compare blood pressure before and after lifestyle improvement
■ Various functions
·record
Since the recording screen is displayed after the application starts, you can record quickly.
In addition to systolic blood pressure, diastolic blood pressure, and pulse, it also
Freely customizable tag information can also be recorded together.
From the setting screen, you can enable the input of weight and measurement time.
・List
Measurement results can be displayed in an easy-to-read list format.
If you measure multiple times in one day, the average value is also displayed.
·analysis
In addition to graph display of systolic blood pressure, diastolic blood pressure, and pulse
You can also display a graph summarizing the degree and frequency of hypertension and the summary results by tag.
Also, by tapping the arrow button on the upper right of the graph, you can transition to the screen where the measurement results of the two periods are compared graphically.
・Report
Changes in daily average values and a list can be output in PDF format.
Please use it for documents to be submitted to doctors.
·setting
You can set input items and customize tags.
In addition, CSV backup of measurement results and CSV files edited on a PC can be imported.
■ Request
If you have any features or bugs that you would like to see added, please feel free to leave a review!
Updated on
Safety starts with understanding how developers collect and share your data. Data privacy and security practices may vary based on your use, region, and age. The developer provided this information and may update it over time.

No data shared with third parties
Learn more about how developers declare sharing

This app may collect these data types
App info and performance

Data is encrypted in transit

Data can’t be deleted
What's new
分析タブのグラフをタップした際に表示される吹き出しが重なって表示される不具合を修正しました。


