Linear Fit
1 હજાર+
ડાઉનલોડ

પ્રત્યેક
info
આ ઍપનું વર્ણન
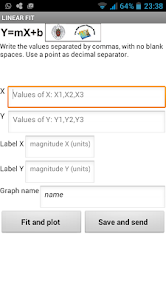
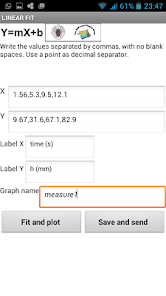
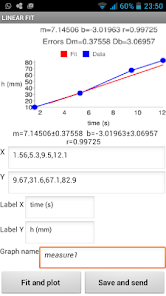
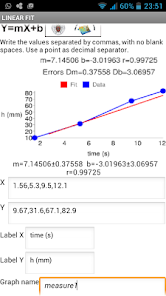
This program performs a linear fit of the data provided in X Y coordinates. X data are introduced into a cell and Y data are also introduced in another cell. Numbers should be written separated by commas, with no blank spaces. The point must be used as decimal separator. Press the "Fit and plot" button to perform the linear fit. The program calculates the line Y = m * X + b of best fit to the data (least square method) and displays the value of the slope "m" and the intercept "b". Errors of these magnitudes are shown. The value of the correlation coefficient, which indicates the goodness of fit, is also shown. Using the "Google Image Charts" the program generates a graph with the data and the fitted line. You can add axis labels and a name for the graph to be saved later. By Pressing the button "Save and send", the graph (with the previous name) is sent using the available device resources. A copy of the graph is also stored in the device.
આ રોજ અપડેટ કર્યું
ડેવલપર તમારો ડેટા કેવી રીતે એકત્રિત અને શેર કરે છે, તે સમજવાથી સુરક્ષાની શરૂઆત થાય છે. તમારા દ્વારા ઍપનો ઉપયોગ, ઉપયોગ થાય તે પ્રદેશ અને તમારી ઉંમરના આધારે ડેટાની પ્રાઇવસી અને સુરક્ષા પદ્ધતિઓ અલગ-અલગ હોઈ શકે છે. ડેવલપર દ્વારા આ માહિતી પ્રદાન કરવામાં આવી છે અને તેઓ સમયાંતરે તેને અપડેટ કરી શકે છે.


