iFORA Diabetes Manager
3,0star
221 avis
10K+
Téléchargements

Tout public
info


À propos de l'application
iFORA - Diabetes Manager app designed to make busy lives easier to manage. iFORA comes with advanced mobile technology, sleek interface design, detailed and yet careful data management tools to assist you in better diabetes management. The easy-to-use tools can help you better understand how your blood glucose level interlinks with a positive self-monitoring process through recording, tracking, seeing your diabetes information in statistic trend graphs, target pie charts and exporting data to Fora TeleHealth solution to share with your doctor.
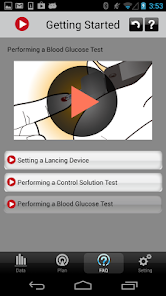
See your glucose variations over the period of 7-14-30 days. With a target goal you can determine how well you have managed over the period of time and seek advises from your doctor. With an extensive FAQ database, you can learn more about the medication that you are taking and how a good diabetes management can be achieve by healthy eating, regular exercise routine and through lifestyle choices.
Post your screen images on Facebook and by email or share your information with your doctor instantly through ForaCare's advanced TeleHealth solution software.
The app works smoothly with the Diamond Mini and Diamond Voice via Bluetooth connection and iDiamond Blood Glucose Monitoring System to directly connect to an iPhone® or iPod touch®.
Features of the software include:
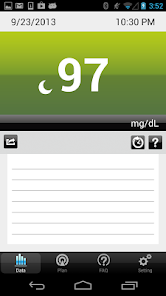
DATA RECORD
Note down your activities with each measurement.
Blood glucose results are color coded, with Red for too high, Green for Normal and Yellow for too low.
RECORD LIST
See your results sorted by time.
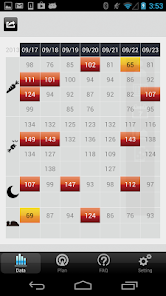
LOGBOOK
Blood glucose management at a glance! Data is displayed in a weekly format, for AC, PC, night and sleep, with the color coding system making it much easier to see the usual ups and downs of blood glucose level during the week.
TREND GRAPH
Data is organized into an interactive trend chart, where you will be able to connect the dots of 4 different measurement modes to see how the blood glucose level have gone up and down at different times of the day.
STANDARD DAY
Understand your weekly lifestyle! See the glucose readings overlaying on one single graph, in past 7, 14 and 30days. Identify activities that lead to extreme glucose levels.
DIARY
See instantly how insulin dosage, medication, activities and food intake impact your blood glucose levels. The graphs are displayed in a scale of 24-hour period, from midnight to midnight.
Please note:
This application is information recording and self-monitoring tool only and is not intended to diagnose, prevent or recommend treatment for any disease or illness.
Consult your doctor for informed medical advice about your health and more.
See your glucose variations over the period of 7-14-30 days. With a target goal you can determine how well you have managed over the period of time and seek advises from your doctor. With an extensive FAQ database, you can learn more about the medication that you are taking and how a good diabetes management can be achieve by healthy eating, regular exercise routine and through lifestyle choices.
Post your screen images on Facebook and by email or share your information with your doctor instantly through ForaCare's advanced TeleHealth solution software.
The app works smoothly with the Diamond Mini and Diamond Voice via Bluetooth connection and iDiamond Blood Glucose Monitoring System to directly connect to an iPhone® or iPod touch®.
Features of the software include:
DATA RECORD
Note down your activities with each measurement.
Blood glucose results are color coded, with Red for too high, Green for Normal and Yellow for too low.
RECORD LIST
See your results sorted by time.
LOGBOOK
Blood glucose management at a glance! Data is displayed in a weekly format, for AC, PC, night and sleep, with the color coding system making it much easier to see the usual ups and downs of blood glucose level during the week.
TREND GRAPH
Data is organized into an interactive trend chart, where you will be able to connect the dots of 4 different measurement modes to see how the blood glucose level have gone up and down at different times of the day.
STANDARD DAY
Understand your weekly lifestyle! See the glucose readings overlaying on one single graph, in past 7, 14 and 30days. Identify activities that lead to extreme glucose levels.
DIARY
See instantly how insulin dosage, medication, activities and food intake impact your blood glucose levels. The graphs are displayed in a scale of 24-hour period, from midnight to midnight.
Please note:
This application is information recording and self-monitoring tool only and is not intended to diagnose, prevent or recommend treatment for any disease or illness.
Consult your doctor for informed medical advice about your health and more.
Date de mise à jour
La sécurité, c'est d'abord comprendre comment les développeurs collectent et partagent vos données. Les pratiques concernant leur confidentialité et leur protection peuvent varier selon votre utilisation, votre région et votre âge. Le développeur a fourni ces informations et peut les modifier ultérieurement.

Aucune donnée partagée avec des tiers
En savoir plus sur la manière dont les développeurs déclarent le partage

Cette appli peut recueillir ces types de données
Forme et santé

Les données sont chiffrées lors de leur transfert

Vous pouvez demander la suppression des données
Notes et avis
3,0
208 avis
Nouveautés
Importing data sometimes gets stuck.


