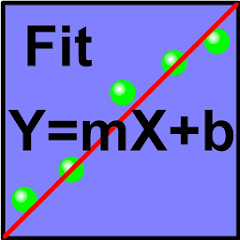
Linear Fit
+1 ہزار
ڈاؤن لوڈز

ہر کوئی
info
اس ایپ کے بارے میں
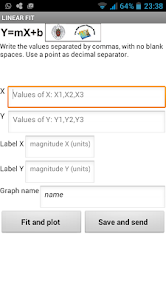
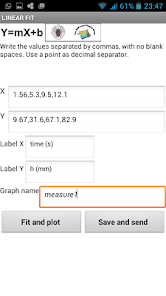
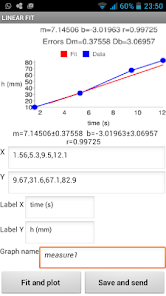
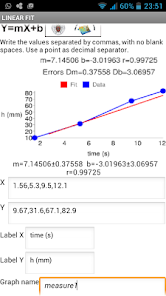
This program performs a linear fit of the data provided in X Y coordinates. X data are introduced into a cell and Y data are also introduced in another cell. Numbers should be written separated by commas, with no blank spaces. The point must be used as decimal separator. Press the "Fit and plot" button to perform the linear fit. The program calculates the line Y = m * X + b of best fit to the data (least square method) and displays the value of the slope "m" and the intercept "b". Errors of these magnitudes are shown. The value of the correlation coefficient, which indicates the goodness of fit, is also shown. Using the "Google Image Charts" the program generates a graph with the data and the fitted line. You can add axis labels and a name for the graph to be saved later. By Pressing the button "Save and send", the graph (with the previous name) is sent using the available device resources. A copy of the graph is also stored in the device.
اپ ڈیٹ کردہ بتاریخ
سیفٹی اس بات کو سمجھنے کے ساتھ شروع ہوتی ہے کہ ڈویلپرز آپ کا ڈیٹا کیسے اکٹھا اور اس کا اشتراک کرتے ہیں۔ ڈیٹا کی رازداری اور سیکیورٹی کے طریقے آپ کے استعمال، علاقے اور عمر کی بنیاد پر مختلف ہو سکتے ہیں۔ ڈویلپر نے یہ معلومات فراہم کی ہے اور وقت کے ساتھ ساتھ اسے اپ ڈیٹ کر سکتا ہے۔

فریقین ثالث کے ساتھ کسی بھی ڈیٹا کا اشتراک نہیں کیا گیا
ڈویلپرز کے اشتراک کے اعلان کے بارے میں مزید جانیں

کوئی ڈیٹا اکٹھا نہیں کیا گیا
ڈویلپرز کے اکٹھا کرنے کے اعلان کے طریقے بارے میں مزید جانیں


