
Skew-t
4.3star
245 جائزے
+10 ہزار
ڈاؤن لوڈز

ہر کوئی
info

اس ایپ کے بارے میں
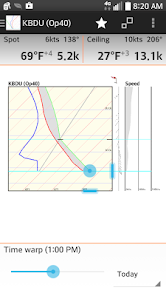
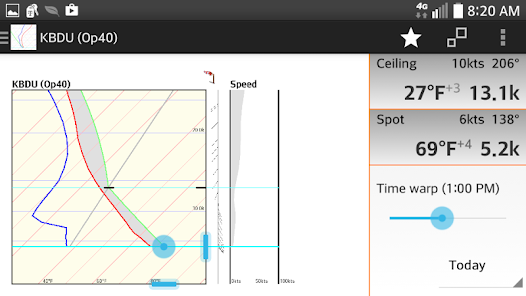
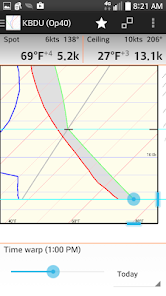
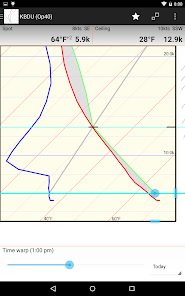
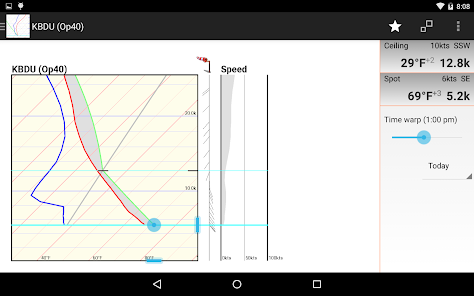
Skew-T Log-P diagrams are commonly used for weather analysis and forecasting. They graph weather balloon data to show the vertical profile of the temperature and dew point through the atmosphere.
See the following Finger Lakes Soaring Club web link for a great article describing how glider pilots use skew-t graphs to predict weather for a days flight.
http://www.flsc.org/portals/12/PDF/Read_Skew_T.pdf
Features:
Uses data from http://rucsoundings.noaa.gov/
Automatically download the day's weather data
Use the slider to quickly view all hour-by-hour graphs.
Zoom to inspect the graph details
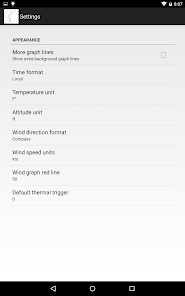
Configurable units and graph lines
Use different weather models
Show forecast graphs for the next few days
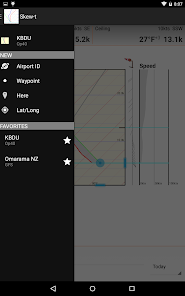
Saved favorites to quickly view different locations and/or weather models.
Here mode uses GPS to easily get graphs for your current location.
Load waypoints from files.
See the following Finger Lakes Soaring Club web link for a great article describing how glider pilots use skew-t graphs to predict weather for a days flight.
http://www.flsc.org/portals/12/PDF/Read_Skew_T.pdf
Features:
Uses data from http://rucsoundings.noaa.gov/
Automatically download the day's weather data
Use the slider to quickly view all hour-by-hour graphs.
Zoom to inspect the graph details
Configurable units and graph lines
Use different weather models
Show forecast graphs for the next few days
Saved favorites to quickly view different locations and/or weather models.
Here mode uses GPS to easily get graphs for your current location.
Load waypoints from files.
اپ ڈیٹ کردہ بتاریخ
سیفٹی اس بات کو سمجھنے کے ساتھ شروع ہوتی ہے کہ ڈویلپرز آپ کا ڈیٹا کیسے اکٹھا اور اس کا اشتراک کرتے ہیں۔ ڈیٹا کی رازداری اور سیکیورٹی کے طریقے آپ کے استعمال، علاقے اور عمر کی بنیاد پر مختلف ہو سکتے ہیں۔ ڈویلپر نے یہ معلومات فراہم کی ہے اور وقت کے ساتھ ساتھ اسے اپ ڈیٹ کر سکتا ہے۔

فریقین ثالث کے ساتھ کسی بھی ڈیٹا کا اشتراک نہیں کیا گیا
ڈویلپرز کے اشتراک کے اعلان کے بارے میں مزید جانیں

کوئی ڈیٹا اکٹھا نہیں کیا گیا
ڈویلپرز کے اکٹھا کرنے کے اعلان کے طریقے بارے میں مزید جانیں
درجہ بندی اور جائزے
4.4
224 جائزے
نیا کیا ہے
Android version update


