Linear Fit
1 hilj.+
Preuzimanja

Svako
info
O aplikaciji
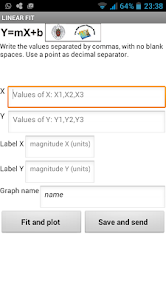
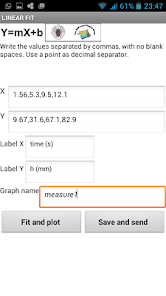
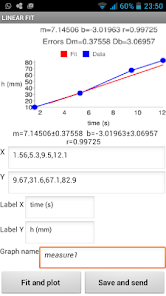
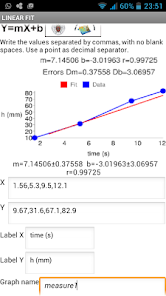
This program performs a linear fit of the data provided in X Y coordinates. X data are introduced into a cell and Y data are also introduced in another cell. Numbers should be written separated by commas, with no blank spaces. The point must be used as decimal separator. Press the "Fit and plot" button to perform the linear fit. The program calculates the line Y = m * X + b of best fit to the data (least square method) and displays the value of the slope "m" and the intercept "b". Errors of these magnitudes are shown. The value of the correlation coefficient, which indicates the goodness of fit, is also shown. Using the "Google Image Charts" the program generates a graph with the data and the fitted line. You can add axis labels and a name for the graph to be saved later. By Pressing the button "Save and send", the graph (with the previous name) is sent using the available device resources. A copy of the graph is also stored in the device.
Ažurirano dana
Sigurnost počinje razumijevanjem na koji način programeri prikupljaju i dijele vaše podatke. Privatnost podataka i sigurnosne prakse se mogu razlikovati ovisno o korištenju, regiji i dobi. Programer je naveo ove informacije i može ih s vremenom ažurirati.

Podaci se ne dijele s trećim stranama
Saznajte više o načinu na koji programeri pružaju izjavu o dijeljenju

Podaci se ne prikupljaju
Saznajte više o načinu na koji programeri pružaju izjavu o prikupljanju
Podrška za aplikaciju
Informacije o programeru
Oscar Gómez Calderón
oscar.gomezcalderon@gmail.com
Spain


