
ナンバーズデータグラフアプリ
Contains ads
1K+
Downloads

Teen
info

About this app
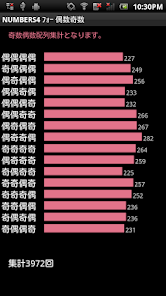
The winning rankings are straight and box.
Why not take a look to see which winning numbers have the most wins?
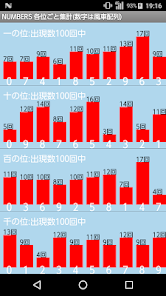
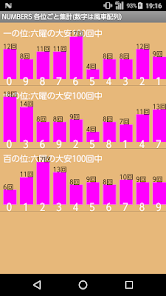
1. Layout of Count Results:
When you switch to individual counting, the graph will be displayed in a pinwheel layout.
This gives you a sense of location.
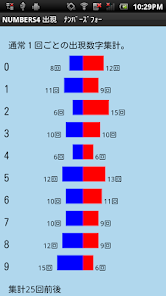
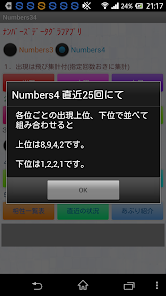
2. Recent Status Feature:
To help you understand the most recent situation, the graph will change the count each time you tap the screen.
For a more concise view, the top and bottom numbers are displayed based on the number of appearances in the last 25 graph results.
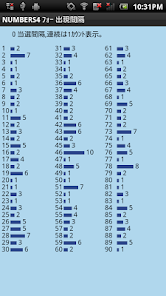
3. Streak Count:
By tallying the periods when certain numbers have not appeared, you can see which numbers have not appeared for a long period of time.
4. How to Use the Data:
Even with a large amount of data, it can only be used as a reference for choosing numbers and does not guarantee a win.
Just to let you know,
I can display the data simply because I've been inputting it all this time.
The program is very simple,
but when I actually tried to sort 6,000 pieces of data,
it was incredibly difficult to use the original data for the program.
So,
I'm updating the data daily while the app is being distributed.
Why not take a look to see which winning numbers have the most wins?
1. Layout of Count Results:
When you switch to individual counting, the graph will be displayed in a pinwheel layout.
This gives you a sense of location.
2. Recent Status Feature:
To help you understand the most recent situation, the graph will change the count each time you tap the screen.
For a more concise view, the top and bottom numbers are displayed based on the number of appearances in the last 25 graph results.
3. Streak Count:
By tallying the periods when certain numbers have not appeared, you can see which numbers have not appeared for a long period of time.
4. How to Use the Data:
Even with a large amount of data, it can only be used as a reference for choosing numbers and does not guarantee a win.
Just to let you know,
I can display the data simply because I've been inputting it all this time.
The program is very simple,
but when I actually tried to sort 6,000 pieces of data,
it was incredibly difficult to use the original data for the program.
So,
I'm updating the data daily while the app is being distributed.
Updated on
Safety starts with understanding how developers collect and share your data. Data privacy and security practices may vary based on your use, region, and age. The developer provided this information and may update it over time.

No data shared with third parties
Learn more about how developers declare sharing

This app may collect these data types
Location, App activity and 2 others

Data is encrypted in transit

Data can’t be deleted
App support
About the developer
赤坂 保
allteiji5@gmail.com
菖蒲町新堀
2041番地3
久喜市, 埼玉県 346-0105
Japan