
野外調査地図
10K+
Downloads

Everyone
info


About this app
●Main features
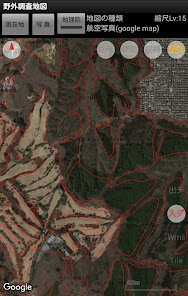
Records track logs and points like a portable GPS.
Acquisition of elevation values to track logs and point data.
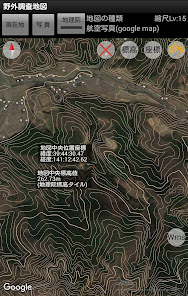
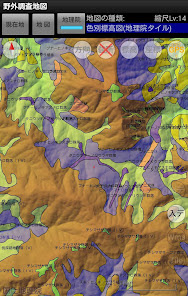
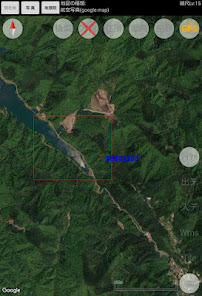
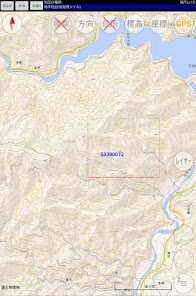
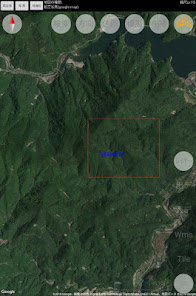
Display of maps, aerial photographs, topographic maps, aerial photograph ortho images, etc.
Display of map tiles including GIS data, WMS and originals.
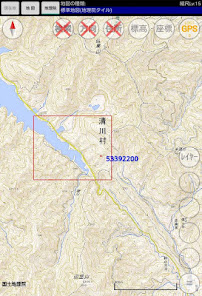
Displays the elevation value at the center of the screen, the range of the tertiary mesh, and the mesh code.
Displays the azimuth and elevation/depression angles, with the top of the screen facing like a clinometer.
A sketch function that allows you to write by hand on the map.
●About permissions used by the app
This app uses the following permissions.
・android.permission.FOREGROUND_SERVICE_LOCATION
・android.permission.READ_MEDIA_IMAGES
android.permission.FOREGROUND_SERVICE_LOCATION is used for track logging.
Track logging starts only on user instruction. This permission is required to obtain location information and continue recording track logs even when the app is closed. If the use of this permission is not permitted, track log recording will only be possible while the app is running.
android.permission.READ_MEDIA_IMAGES is used to display photos taken by the user with a camera app, etc. on the map screen of this app. If you are not permitted to use this permission, you will not be able to display photos on the map screen.
●Notes
This app is being developed by an individual. It is not provided by the Geospatial Information Authority of Japan.
When using Geospatial Information Authority of Japan tiles, please refer to "About the use of Geospatial Information Authority of Japan tiles" on the Geospatial Information Authority of Japan website and use them in accordance with the Geospatial Information Authority of Japan content usage terms.
●How to use
When installed, a folder called FieldStudyMap will be created on the sdcard (depending on the model).
The following folders will be created within it.
output: Track log and point data will be saved.
save: When you "save" output data (track log, points) in the in-app menu, the data will be moved here.
export: When you "export" the output data, GIS files, GPS files, etc. are created here.
input: Enter the GIS file, GPS file, etc. you want to display here.
cj: The cache of Geographical Survey Institute tiles is saved.
wms: Stores WMS configuration files and cache.
tiles: Stores map tile configuration files and caches. Insert the original map tile you want to display here.
sketch: Sketch data is saved.
bookmark: Bookmarks are saved.
1. Geographical Survey Institute tile display
Select "Precautions for using the Geospatial Information Authority of Japan tiles" under "Others" in the "Menu", and after confirming the contents, press the "Agree" button.The Geospatial Information Authority of Japan button will be enabled, and when you press it, will be displayed.
While the Geographical Survey Institute tiles are displayed, the background of the place where the map type name is displayed to the right of the Geographical Survey Institute button turns blue.
By pressing this blue area, you can change the type of Geographical Survey Institute tile displayed.
2. Track log, record points
Track log recording can be started and stopped from the track menu.
There is no need to have the app running while recording track logs.
Track log recording continues even if you start another app.
To record points, select Points from the menu.
Since altitude values obtained by GPS have large errors, there is a function to obtain altitude values from the Geospatial Information Authority of Japan.
Obtaining Geographical Survey Institute elevation values uses elevation tiles as the default.
It is also possible to use the Geographical Survey Institute Elevation API, which has higher accuracy (depending on the region), but it is usually not recommended as it takes a considerable amount of time as it is heavily weighted to avoid load on the server.
3. export
The above output data can be exported to shapefile, trk, wpt file.
If Geographical Survey Institute elevation values have been obtained, they will also be exported.
4. Display of GIS data etc.
For the GIS files and GPS files you want to display, create a folder with an appropriate name in the input folder and put them there.
The folder name will be displayed in the input data of the menu, so select the folder you want to display.
If you put the file directly in the input folder, it will be automatically loaded at startup.
Data files that can be read are world geodetic system points, polylines, polygons, and multipoints.
trk and wpt files are in the world geodetic system latitude and longitude decimal notation format.
You can put multiple files in one folder.
When loading a shapefile for the first time, a dialog is displayed to select the attributes to be used for the label.
Objects are colored by the selected attribute.
Once you have selected an attribute, you can change it to another attribute using the display style settings.
The colors used for color coding are determined randomly.
Change the color by editing the color scheme specification file.
5. Use of WMS
To use WMS, you need to put the configuration file in the wms folder.
There is a function to create and edit configuration files in the Other Toolbox in the menu.
When you enter a configuration file, the configuration file name will be displayed in Other WMS in the menu, so select the WMS you want to display.
The WMS button is displayed while WMS is displayed.
When you press the button, the WMS display changes from semi-transparent to non-display.
Even if you hide it, WMS information will continue to be retrieved. If you no longer need to display WMS, please cancel the display from the menu.
6. Using map tiles
To use map tiles, you need to put the configuration file in the tiles folder.
There is a function to create and edit configuration files in the Other Toolbox in the menu.
When you insert the settings file, the settings file name will be displayed on the map tile in the menu, so select the map tile you want to display.
Zoom level offset is usually 0. If a value other than 0 is specified, tiles with a zoom level that is the googlemap zoom level plus an offset will be displayed. For models with high-definition displays, setting 1 may display better images, but the number of tiles to be displayed increases, which consumes more memory and battery power.
Please follow the data provider's terms of use when using it.
Also, please do not use it for map tiles whose terms of use prohibit direct access.
7. Displaying original map tiles
If you want to load original map tiles, create a folder with an appropriate name in the tiles folder and put the map tiles there.
8. Sketch function
When you create and open a new sketch, a panel will be displayed at the top left of the map. You can write on the map by pressing the sketch to make it red. If you enable comments, you can enter comments for each post. Saved sketches can be exported to GIS files, etc.
Records track logs and points like a portable GPS.
Acquisition of elevation values to track logs and point data.
Display of maps, aerial photographs, topographic maps, aerial photograph ortho images, etc.
Display of map tiles including GIS data, WMS and originals.
Displays the elevation value at the center of the screen, the range of the tertiary mesh, and the mesh code.
Displays the azimuth and elevation/depression angles, with the top of the screen facing like a clinometer.
A sketch function that allows you to write by hand on the map.
●About permissions used by the app
This app uses the following permissions.
・android.permission.FOREGROUND_SERVICE_LOCATION
・android.permission.READ_MEDIA_IMAGES
android.permission.FOREGROUND_SERVICE_LOCATION is used for track logging.
Track logging starts only on user instruction. This permission is required to obtain location information and continue recording track logs even when the app is closed. If the use of this permission is not permitted, track log recording will only be possible while the app is running.
android.permission.READ_MEDIA_IMAGES is used to display photos taken by the user with a camera app, etc. on the map screen of this app. If you are not permitted to use this permission, you will not be able to display photos on the map screen.
●Notes
This app is being developed by an individual. It is not provided by the Geospatial Information Authority of Japan.
When using Geospatial Information Authority of Japan tiles, please refer to "About the use of Geospatial Information Authority of Japan tiles" on the Geospatial Information Authority of Japan website and use them in accordance with the Geospatial Information Authority of Japan content usage terms.
●How to use
When installed, a folder called FieldStudyMap will be created on the sdcard (depending on the model).
The following folders will be created within it.
output: Track log and point data will be saved.
save: When you "save" output data (track log, points) in the in-app menu, the data will be moved here.
export: When you "export" the output data, GIS files, GPS files, etc. are created here.
input: Enter the GIS file, GPS file, etc. you want to display here.
cj: The cache of Geographical Survey Institute tiles is saved.
wms: Stores WMS configuration files and cache.
tiles: Stores map tile configuration files and caches. Insert the original map tile you want to display here.
sketch: Sketch data is saved.
bookmark: Bookmarks are saved.
1. Geographical Survey Institute tile display
Select "Precautions for using the Geospatial Information Authority of Japan tiles" under "Others" in the "Menu", and after confirming the contents, press the "Agree" button.The Geospatial Information Authority of Japan button will be enabled, and when you press it, will be displayed.
While the Geographical Survey Institute tiles are displayed, the background of the place where the map type name is displayed to the right of the Geographical Survey Institute button turns blue.
By pressing this blue area, you can change the type of Geographical Survey Institute tile displayed.
2. Track log, record points
Track log recording can be started and stopped from the track menu.
There is no need to have the app running while recording track logs.
Track log recording continues even if you start another app.
To record points, select Points from the menu.
Since altitude values obtained by GPS have large errors, there is a function to obtain altitude values from the Geospatial Information Authority of Japan.
Obtaining Geographical Survey Institute elevation values uses elevation tiles as the default.
It is also possible to use the Geographical Survey Institute Elevation API, which has higher accuracy (depending on the region), but it is usually not recommended as it takes a considerable amount of time as it is heavily weighted to avoid load on the server.
3. export
The above output data can be exported to shapefile, trk, wpt file.
If Geographical Survey Institute elevation values have been obtained, they will also be exported.
4. Display of GIS data etc.
For the GIS files and GPS files you want to display, create a folder with an appropriate name in the input folder and put them there.
The folder name will be displayed in the input data of the menu, so select the folder you want to display.
If you put the file directly in the input folder, it will be automatically loaded at startup.
Data files that can be read are world geodetic system points, polylines, polygons, and multipoints.
trk and wpt files are in the world geodetic system latitude and longitude decimal notation format.
You can put multiple files in one folder.
When loading a shapefile for the first time, a dialog is displayed to select the attributes to be used for the label.
Objects are colored by the selected attribute.
Once you have selected an attribute, you can change it to another attribute using the display style settings.
The colors used for color coding are determined randomly.
Change the color by editing the color scheme specification file.
5. Use of WMS
To use WMS, you need to put the configuration file in the wms folder.
There is a function to create and edit configuration files in the Other Toolbox in the menu.
When you enter a configuration file, the configuration file name will be displayed in Other WMS in the menu, so select the WMS you want to display.
The WMS button is displayed while WMS is displayed.
When you press the button, the WMS display changes from semi-transparent to non-display.
Even if you hide it, WMS information will continue to be retrieved. If you no longer need to display WMS, please cancel the display from the menu.
6. Using map tiles
To use map tiles, you need to put the configuration file in the tiles folder.
There is a function to create and edit configuration files in the Other Toolbox in the menu.
When you insert the settings file, the settings file name will be displayed on the map tile in the menu, so select the map tile you want to display.
Zoom level offset is usually 0. If a value other than 0 is specified, tiles with a zoom level that is the googlemap zoom level plus an offset will be displayed. For models with high-definition displays, setting 1 may display better images, but the number of tiles to be displayed increases, which consumes more memory and battery power.
Please follow the data provider's terms of use when using it.
Also, please do not use it for map tiles whose terms of use prohibit direct access.
7. Displaying original map tiles
If you want to load original map tiles, create a folder with an appropriate name in the tiles folder and put the map tiles there.
8. Sketch function
When you create and open a new sketch, a panel will be displayed at the top left of the map. You can write on the map by pressing the sketch to make it red. If you enable comments, you can enter comments for each post. Saved sketches can be exported to GIS files, etc.
Updated on
Safety starts with understanding how developers collect and share your data. Data privacy and security practices may vary based on your use, region, and age. The developer provided this information and may update it over time.

No data shared with third parties
Learn more about how developers declare sharing

No data collected
Learn more about how developers declare collection

Data is encrypted in transit

Data can’t be deleted
What’s new
アプリの使用方法を解説するホームページを開設しました。 https://fieldstudymap.com/
バージョン 12.7 (2025/7/30)
1.android15に対応しました。
バージョン 12.6 (2025/6/5)
1.2025年6月3日頃から発生するようになった不具合への対応を行いました。不具合をこちらで再現できていないので、対応できたか不確実です。
バージョン 12.5 (2025/1/14)
1.いくつかの不具合を修正しました。
バージョン 12.4 (2024/10/30)
1.新しい地理院タイルに対応しました。
2.いくつかの不具合を修正しました。
バージョン 12.3 (2024/8/20)
1.android14に対応しました。
2.新しい地理院タイルに対応しました。
3.いくつかの不具合を修正しました。
バージョン 12.2 (2024/5/2)
1.端末の向きの取得方法を新しい方法(Fused Orientation Provider)に変更、コンパス表示の追加ほか。
App support
About the developer
杉山 廣雄
shima_neko3@fieldstudymap.com
Japan
undefined