
グラフで見る世界の統計
Contains ads
100+
Downloads

Everyone
info


About this app
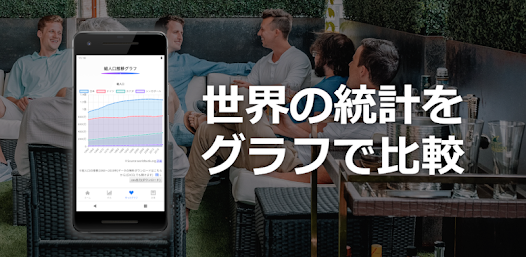
The world statistics shown in graphs provide easy-to-understand explanations of economic, population, environment, education, and health-related statistical information around the world using graphs, charts, and comparison tables.
In addition, the graph creation tool allows you to "select countries freely and easily create graphs for each statistic."
If you select multiple countries, you can also compare statistical information of Japan and other countries around the world.
[Recommended for such people]
・Those who want to know the statistical information of each country in the world easily and easily.
・Person who wants to see the world ranking of each statistic
・Person who wants to download world statistical data for free
・ Those who want to compare statistics with Japan and neighboring countries in graphs and tables
・Person who wants to see changes from the past and chronology, such as changes in population
・People who have spare time
The graphs, transition charts, and lists posted in the app can be downloaded as csv format data for free.
Therefore, it can be used for learning and research/analysis reports.
*Csv can also be opened in EXCEL or spreadsheet.
[Example of statistical information that can be seen in the graph]
·Total population
·Average life
・Death rate
・Elderly population (ratio/increase rate)
・Gross domestic product (nominal GDP)
・Market capitalization of domestic listed companies
・CO2 emissions
・Forest area
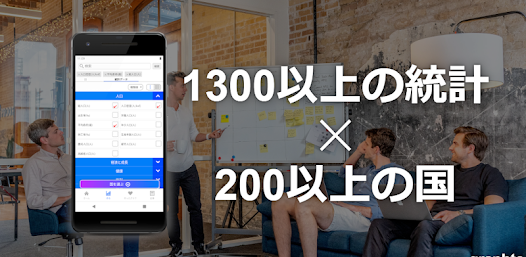
And more than 1000 kinds of statistical information are posted.
further,
Their statistics
By combining with over 200 countries,
It is also possible to "compare easily with graphs and tables".
Also,
The statistics posted in the "Statistics of the world in graphs" application are updated daily, so it is possible to know the latest information.
If you have other requests such as new functions for graphs and tables, or want to incorporate such statistics, please let us know. We will improve it and aim for a better application.
Thank you for using this app.
In addition, the graph creation tool allows you to "select countries freely and easily create graphs for each statistic."
If you select multiple countries, you can also compare statistical information of Japan and other countries around the world.
[Recommended for such people]
・Those who want to know the statistical information of each country in the world easily and easily.
・Person who wants to see the world ranking of each statistic
・Person who wants to download world statistical data for free
・ Those who want to compare statistics with Japan and neighboring countries in graphs and tables
・Person who wants to see changes from the past and chronology, such as changes in population
・People who have spare time
The graphs, transition charts, and lists posted in the app can be downloaded as csv format data for free.
Therefore, it can be used for learning and research/analysis reports.
*Csv can also be opened in EXCEL or spreadsheet.
[Example of statistical information that can be seen in the graph]
·Total population
·Average life
・Death rate
・Elderly population (ratio/increase rate)
・Gross domestic product (nominal GDP)
・Market capitalization of domestic listed companies
・CO2 emissions
・Forest area
And more than 1000 kinds of statistical information are posted.
further,
Their statistics
By combining with over 200 countries,
It is also possible to "compare easily with graphs and tables".
Also,
The statistics posted in the "Statistics of the world in graphs" application are updated daily, so it is possible to know the latest information.
If you have other requests such as new functions for graphs and tables, or want to incorporate such statistics, please let us know. We will improve it and aim for a better application.
Thank you for using this app.
Updated on
Safety starts with understanding how developers collect and share your data. Data privacy and security practices may vary based on your use, region and age The developer provided this information and may update it over time.

No data shared with third parties
Learn more about how developers declare sharing

No data collected
Learn more about how developers declare collection
What's new
対象年齢、アイコンを変更。


