Linear Fit
1 Tsg.+
Downloads

Jedes Alter
info
Über diese App
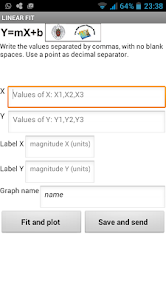
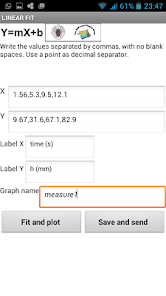
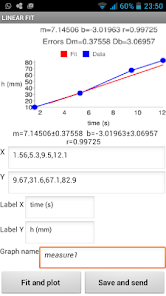
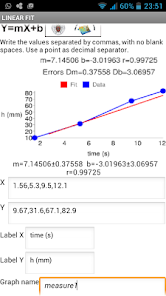
This program performs a linear fit of the data provided in X Y coordinates. X data are introduced into a cell and Y data are also introduced in another cell. Numbers should be written separated by commas, with no blank spaces. The point must be used as decimal separator. Press the "Fit and plot" button to perform the linear fit. The program calculates the line Y = m * X + b of best fit to the data (least square method) and displays the value of the slope "m" and the intercept "b". Errors of these magnitudes are shown. The value of the correlation coefficient, which indicates the goodness of fit, is also shown. Using the "Google Image Charts" the program generates a graph with the data and the fitted line. You can add axis labels and a name for the graph to be saved later. By Pressing the button "Save and send", the graph (with the previous name) is sent using the available device resources. A copy of the graph is also stored in the device.
Aktualisiert am
Was die Sicherheit angeht, solltest du als Erstes verstehen, wie Entwickler deine Daten erheben und weitergeben. Die Datenschutz- und Sicherheitspraktiken können je nach deiner Verwendung, deiner Region und deinem Alter variieren. Diese Informationen wurden vom Entwickler zur Verfügung gestellt und können jederzeit von ihm geändert werden.

Keine Daten werden mit Drittunternehmen oder -organisationen geteilt

Keine Daten erhoben
Support für diese App
Informationen zum Entwickler
Oscar Gómez Calderón
oscar.gomezcalderon@gmail.com
Spain


