
PV Output
Enthält WerbungIn-App-Käufe
4.0star
307 Rezensionen
10 Tsg.+
Downloads

Jedes Alter
info

Über diese App
If you use www.pvoutput.org then this app is for you!
See the Getting Started guide at http://pvoutputapp.mcdonalds.id.au/
General features include:
- Pull out the navigation draw from the left.
- Search for and Add any System or Team from pvoutput.org.
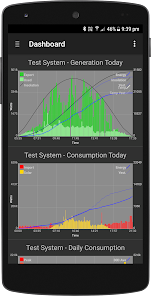
- Build your own dashboard with your favourite graphs. Click on the dashboard graphs to jump to the system page.
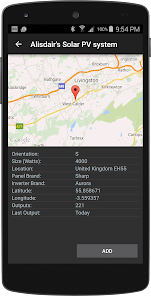
System Pages:
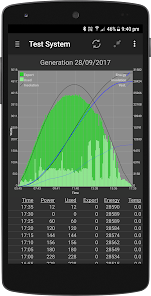
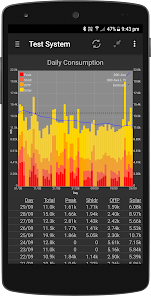
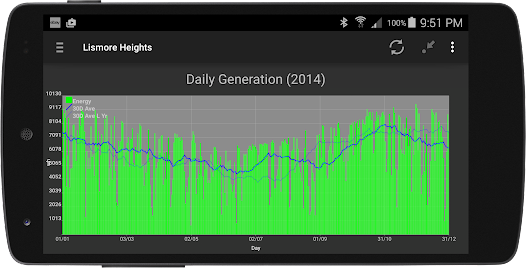
- Intraday, Daily, Weekly, Monthly and Yearly system pages.
- Swipe left/right to move between Intradays, Daily, Weekly, Monthly and Yearly graphs.
- Swipe up/down to move between Generation, Consumption, Import/Export kWH, Import/Export Monetary and Extended Data.
- Use menu on the system page to Add to Dashboard, View/Edit System Details, Edit TOU Tariffs, manually add outputs, refresh all data or delete the system from the app.
- Portrait shows graph and data grid. Click on data heading to hide the graph to view data list in full screen. Click heading line again to restore the graph.
- Rotate to landscape to see full screen graph.
- Drill using a list click or long press.
System Pages Drill Mode:
- Indicated by drill period in round brackets in page heading.
- When in drill mode, swipe left/right to move period. eg: move from month to month, year to year etc.
- Use the back button to exit Drill Mode.
- Access Drill Mode via list click or long press.
Home Screen Widgets:
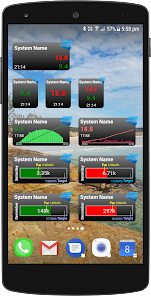
- Keep informed by nice homescreen widgets.
- A basic 1x1 text widget for free.
- In-app subscription (7 day free trial) for additional Text, Graph and Progress Bar home screen widget options.
- Place a 2x1, resize and then adjust the width/height via the widget configuration screen.
- Click on the system name to re-enter the widget configuration screen.
- Click on the widget to enter the app.
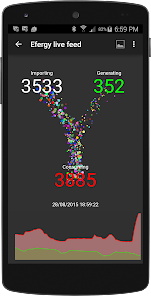
Live Feeds:
- Be mesmerised by the animated dots that represent electricity flowing between the grid (import or export) your solar panel generation and your household comsumption.
- In-app subscription (7 day free trial).
- Great for an in-home display to help your family visualise their real-time power consumption and reduce those bills. Cook some toast and watch those dots fly!
- Currently supports Efergy (Energyhive), VeraLite, SolarEdge and Fronius.
Access to pvoutput.org data is governed by the pvoutput.org API limits and restrictions. If your system has access to the API bonus features, this app can take advantage of higher rate limits and retrieve detail data for other systems.
Don't hesitate to drop me an email (pvoutput@mcdonalds.id.au) with any problems or suggestions.
See the Getting Started guide at http://pvoutputapp.mcdonalds.id.au/
General features include:
- Pull out the navigation draw from the left.
- Search for and Add any System or Team from pvoutput.org.
- Build your own dashboard with your favourite graphs. Click on the dashboard graphs to jump to the system page.
System Pages:
- Intraday, Daily, Weekly, Monthly and Yearly system pages.
- Swipe left/right to move between Intradays, Daily, Weekly, Monthly and Yearly graphs.
- Swipe up/down to move between Generation, Consumption, Import/Export kWH, Import/Export Monetary and Extended Data.
- Use menu on the system page to Add to Dashboard, View/Edit System Details, Edit TOU Tariffs, manually add outputs, refresh all data or delete the system from the app.
- Portrait shows graph and data grid. Click on data heading to hide the graph to view data list in full screen. Click heading line again to restore the graph.
- Rotate to landscape to see full screen graph.
- Drill using a list click or long press.
System Pages Drill Mode:
- Indicated by drill period in round brackets in page heading.
- When in drill mode, swipe left/right to move period. eg: move from month to month, year to year etc.
- Use the back button to exit Drill Mode.
- Access Drill Mode via list click or long press.
Home Screen Widgets:
- Keep informed by nice homescreen widgets.
- A basic 1x1 text widget for free.
- In-app subscription (7 day free trial) for additional Text, Graph and Progress Bar home screen widget options.
- Place a 2x1, resize and then adjust the width/height via the widget configuration screen.
- Click on the system name to re-enter the widget configuration screen.
- Click on the widget to enter the app.
Live Feeds:
- Be mesmerised by the animated dots that represent electricity flowing between the grid (import or export) your solar panel generation and your household comsumption.
- In-app subscription (7 day free trial).
- Great for an in-home display to help your family visualise their real-time power consumption and reduce those bills. Cook some toast and watch those dots fly!
- Currently supports Efergy (Energyhive), VeraLite, SolarEdge and Fronius.
Access to pvoutput.org data is governed by the pvoutput.org API limits and restrictions. If your system has access to the API bonus features, this app can take advantage of higher rate limits and retrieve detail data for other systems.
Don't hesitate to drop me an email (pvoutput@mcdonalds.id.au) with any problems or suggestions.
Aktualisiert am
Was die Sicherheit angeht, solltest du als Erstes verstehen, wie Entwickler deine Daten erheben und weitergeben. Die Datenschutz- und Sicherheitspraktiken können je nach deiner Verwendung, deiner Region und deinem Alter variieren. Diese Informationen wurden vom Entwickler zur Verfügung gestellt und können jederzeit von ihm geändert werden.

Diese App kann die folgenden Datentypen an Dritte weitergeben
App-Aktivitäten und Geräte- oder andere IDs

Keine Daten erhoben

Daten werden bei der Übertragung verschlüsselt

Daten können nicht gelöscht werden
Bewertungen und Rezensionen
3.9
278 Rezensionen
Neuigkeiten
v2.57 (13/01/2021)
- revert AndroidPlot library back to 1.5.7 to avoid crash when opening LiveFeed on older devices.
v2.56 (11/01/2022)
- More LiveFeed crash error catching for diagnostics
v2.55 (12/12/2021)
- Lots of refactoring in response to Lint warnings and other code quality advice
- Add WidgetConfig cache to avoid database contention and ANRs
- Fix WidgetConfig backstack to not end up in main app
- Fix some LiveFeed error handling
- Library updates
Support für diese App
Informationen zum Entwickler
Mark Ian McDonald
pvoutput@mcdonalds.id.au
7 Janson Cl
Lismore Heights NSW 2480
Australia
undefined