Linear Fit
1 мың+
Жүктеп алынғандар

Барлығы үшін
info
Осы қолданба туралы
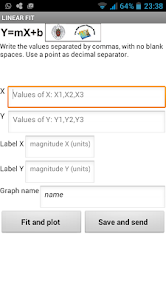
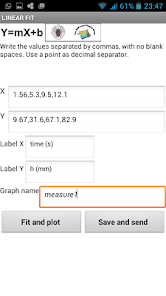
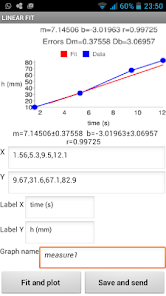
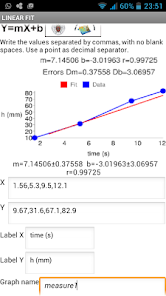
This program performs a linear fit of the data provided in X Y coordinates. X data are introduced into a cell and Y data are also introduced in another cell. Numbers should be written separated by commas, with no blank spaces. The point must be used as decimal separator. Press the "Fit and plot" button to perform the linear fit. The program calculates the line Y = m * X + b of best fit to the data (least square method) and displays the value of the slope "m" and the intercept "b". Errors of these magnitudes are shown. The value of the correlation coefficient, which indicates the goodness of fit, is also shown. Using the "Google Image Charts" the program generates a graph with the data and the fitted line. You can add axis labels and a name for the graph to be saved later. By Pressing the button "Save and send", the graph (with the previous name) is sent using the available device resources. A copy of the graph is also stored in the device.
Жаңартылған күні
Қауіпсіздік ұғымы әзірлеушілердің деректеріңізді қалай жинап, бөлісетінін түсінуден басталады. Дерек құпиялығы мен қауіпсіздік шаралары қолданбаңыздың пайдаланылуына, аймағыңыз бен жасыңызға байланысты әртүрлі болуы мүмкін. Бұл ақпаратты әзірлеуші ұсынды және оны өзгертіп тұруы мүмкін.

Үшінші тараппен ешбір дерек бөлісілмейді.
Әзірлеушілердің деректерді бөлісу бойынша мәлімдемесі туралы толық ақпарат алыңыз.

Деректер жиналмады.
Әзірлеушілердің деректерді жинау бойынша мәлімдемесі туралы толық ақпарат алыңыз.
Қолданбаның қолдау көрсету қызметі
Әзірлеуші туралы
Oscar Gómez Calderón
oscar.gomezcalderon@gmail.com
Spain


