Stock Trade Entry Point
Contient des annoncesAchats via l'appli

1K+
Téléchargements

Tout public
info


À propos de l'application
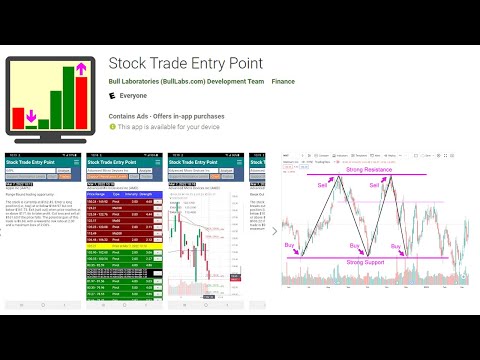
Use the Stock Trade Entry Point application to find trading opportunities as well as optimal entering and exiting prices and other setup for trades to maximize profits and minimize risks.
The analysis starts with finding support and resistance levels based on pivot points, gaps and major moving averages commonly used by traders. The strength of each support and resistance level is further determined by various characteristics of the levels including number of occurrences, volume strength and number of times they have succeeded or failed with providing support or resistance in the past, etc.
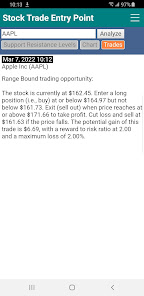
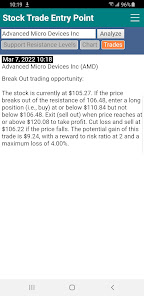
When US market is open, the analysis takes the real time price of the stock (or ETF) in comparison with its support and resistance levels to find suitable trading opportunities. Range bound strategy looks for a large price swing between strong support and resistance levels. Break out strategy looks for opportunities for a price movement to penetrate a resistance level and for the previous resistance level to become support. Break down strategy works similarly to the break out strategy but for the price going in the other direction. There are also cases when the price is going for a ride without any resistance or taking a dive without any support.
Once a suitable trading opportunity is found, the analyzer calculates the entering price with the setup criteria, exit price and cut loss price as well as the gain, maximum losses percentage, and reward-to-risk ratio.
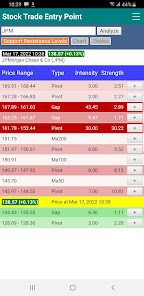
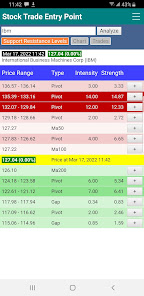
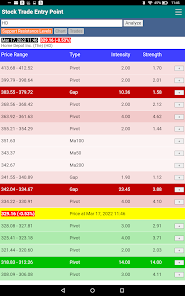
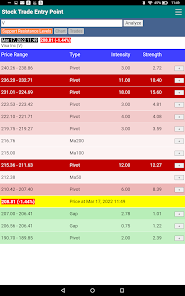
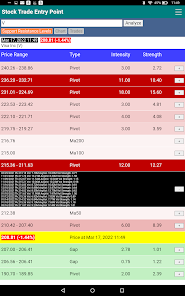
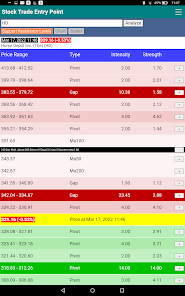
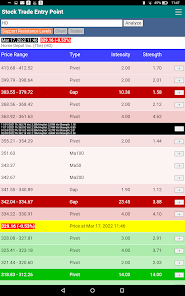
In the Summary screen, support resistance levels are shown with their price ranges, types, intensity and strength. You can also click the “+” (show details) button to bring up the detail view of the level. For the example of a pivot point level, the detail view shows the occurrence of each pivot point instance with its date, price, volume, average volume and volume strength.
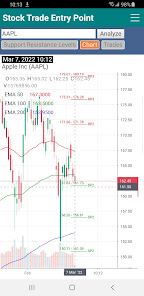
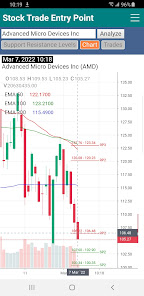
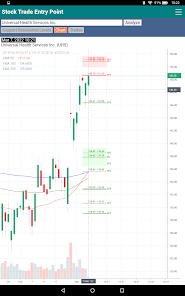
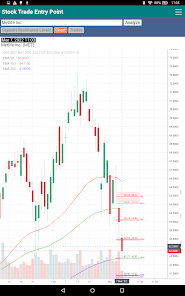
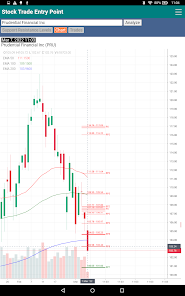
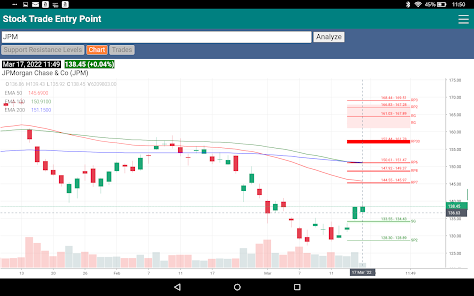
The Chart screen show the candle stick charting of the stock within the analysis date range. The last ticker (current price) is shown with the support resistance levels, gaps and EMAs, which gives a visual representation of where all the prices sit at as well as the strength of the supports and resistances.
The analysis starts with finding support and resistance levels based on pivot points, gaps and major moving averages commonly used by traders. The strength of each support and resistance level is further determined by various characteristics of the levels including number of occurrences, volume strength and number of times they have succeeded or failed with providing support or resistance in the past, etc.
When US market is open, the analysis takes the real time price of the stock (or ETF) in comparison with its support and resistance levels to find suitable trading opportunities. Range bound strategy looks for a large price swing between strong support and resistance levels. Break out strategy looks for opportunities for a price movement to penetrate a resistance level and for the previous resistance level to become support. Break down strategy works similarly to the break out strategy but for the price going in the other direction. There are also cases when the price is going for a ride without any resistance or taking a dive without any support.
Once a suitable trading opportunity is found, the analyzer calculates the entering price with the setup criteria, exit price and cut loss price as well as the gain, maximum losses percentage, and reward-to-risk ratio.
In the Summary screen, support resistance levels are shown with their price ranges, types, intensity and strength. You can also click the “+” (show details) button to bring up the detail view of the level. For the example of a pivot point level, the detail view shows the occurrence of each pivot point instance with its date, price, volume, average volume and volume strength.
The Chart screen show the candle stick charting of the stock within the analysis date range. The last ticker (current price) is shown with the support resistance levels, gaps and EMAs, which gives a visual representation of where all the prices sit at as well as the strength of the supports and resistances.
Date de mise à jour
La sécurité, c'est d'abord comprendre comment les développeurs collectent et partagent vos données. Les pratiques concernant leur confidentialité et leur protection peuvent varier selon votre utilisation, votre région et votre âge. Le développeur a fourni ces informations et peut les modifier ultérieurement.

Aucune donnée partagée avec des tiers
En savoir plus sur la manière dont les développeurs déclarent le partage

Aucune donnée collectée
En savoir plus sur la manière dont les développeurs déclarent la collecte
Nouveautés
.Color shades for representing strengths of support resistance levels for easy understanding of where current price stand in one glimpse.
.Include more data (current price and change percentage from previous close) on various screens for easy usages.
.Include more data (current price and change percentage from previous close) on various screens for easy usages.


