Fibonaci Projection Calculator
Reklamalar mavjudIlova ichida xaridlar
5 ming+
Yuklanmalar

Hamma uchun
info


Bu ilova haqida
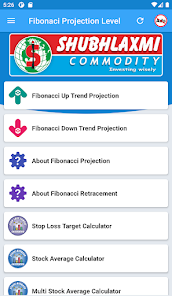
About Fibonacci Price Projections
Traders often get excited when they believe they can use an indicator or tool to ‘project’ prices into the future, but in reality, price projections just give us a possible target that the market may or may not achieve.
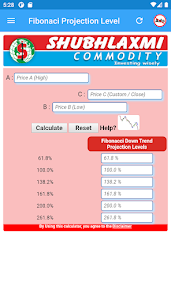
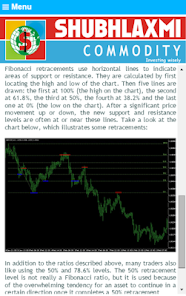
Traders use Fibonacci Price Projections (also called “Extensions”) in a similar manner as Fibonacci Retracements, but they are looking to project where price will travel upwards to hit resistance (in an uptrend) rather than find where price will find support via retracements.
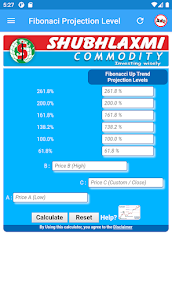
While traders often use Fibonacci ratios 38.2%, 50.0%, and 61.8% for retracements, it is quite common to use 61.8%, 100.0%, 132.8%, and 161.8% for Price Projections and Extensions.
What exactly does this mean?
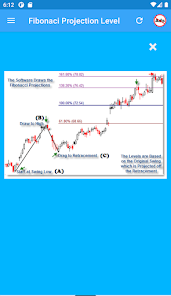
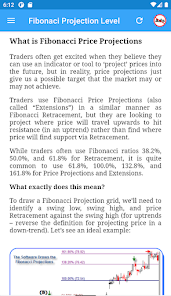
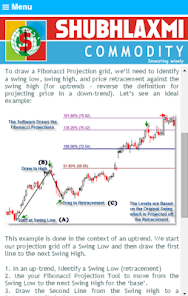
To draw a Fibonacci Projection grid, we’ll need to identify a swing low, swing high, and price retracement against the swing high (for uptrends – reverse the definition for projecting price in a down-trend).
This example is done in the context of an uptrend. We start our projection grid off a Swing Low and then draw the first line to the next Swing High.
1. In an up-trend, Identify a Swing Low (retracement)
2. Use your Fibonacci Projection Tool to move from the Swing Low to the next Swing High for the ‘base’.
3. Draw the Second Line from the Swing High to a Retracement (Swing) Low
The first line (from Swing Low to Swing High) serves as the “Measurement Swing” by which we will soon create Fibonacci Projections. The “Retracement” Swing provides the base from which to project Fibonacci relationships of the first swing.
For example, if the original swing is 100 and our retracement is 70 down, we would take the Fibonacci ratios of the 100 swing (61.8%, 100%, etc) and then add those values to the Retracement Low. Luckily, most software programs do all this for us with three clicks – you just need to know where to point your mouse to click.
Now, unlike the Fibonacci Retracement tool where we are looking to find support, we are now looking to find points above price where the market is likely to experience Overhead Resistance. These will now serve as Profit Targets to help us establish risk/reward relationships.
Traders often get excited when they believe they can use an indicator or tool to ‘project’ prices into the future, but in reality, price projections just give us a possible target that the market may or may not achieve.
Traders use Fibonacci Price Projections (also called “Extensions”) in a similar manner as Fibonacci Retracements, but they are looking to project where price will travel upwards to hit resistance (in an uptrend) rather than find where price will find support via retracements.
While traders often use Fibonacci ratios 38.2%, 50.0%, and 61.8% for retracements, it is quite common to use 61.8%, 100.0%, 132.8%, and 161.8% for Price Projections and Extensions.
What exactly does this mean?
To draw a Fibonacci Projection grid, we’ll need to identify a swing low, swing high, and price retracement against the swing high (for uptrends – reverse the definition for projecting price in a down-trend).
This example is done in the context of an uptrend. We start our projection grid off a Swing Low and then draw the first line to the next Swing High.
1. In an up-trend, Identify a Swing Low (retracement)
2. Use your Fibonacci Projection Tool to move from the Swing Low to the next Swing High for the ‘base’.
3. Draw the Second Line from the Swing High to a Retracement (Swing) Low
The first line (from Swing Low to Swing High) serves as the “Measurement Swing” by which we will soon create Fibonacci Projections. The “Retracement” Swing provides the base from which to project Fibonacci relationships of the first swing.
For example, if the original swing is 100 and our retracement is 70 down, we would take the Fibonacci ratios of the 100 swing (61.8%, 100%, etc) and then add those values to the Retracement Low. Luckily, most software programs do all this for us with three clicks – you just need to know where to point your mouse to click.
Now, unlike the Fibonacci Retracement tool where we are looking to find support, we are now looking to find points above price where the market is likely to experience Overhead Resistance. These will now serve as Profit Targets to help us establish risk/reward relationships.
Oxirgi yangilanish
Xavfsizlik — dastur ishlab chiquvchilar maʼlumotlaringizni qanday jamlashi va ulashishini tushunishdan boshlanadi. Maʼlumotlar maxfiyligi va xavfsizlik amaliyotlari ilovadan foydalanish, hudud va yoshga qarab farq qilishi mumkin. Bu axborot dastur ishlab chiquvchi tomonidan taqdim etilgan va keyinchalik yangilanishi mumkin.

Tashqi hamkorlarga hech qanday axborot ulashilmagan
Dastur ishlab chiquvchilar axborot ulashilishini qanday aytishi haqida batafsil

Hech qanday maʼlumot jamlanmagan
Dastur ishlab chiquvchilar axborot jamlanishini qanday aytishi haqida batafsil

Maʼlumotlar uzatish vaqtida shifrlanadi

Maʼlumotlar oʻchmaydi
Ilova yuzasidan yordam
Dasturchi haqida
Harish S Bhanushali
contact.shubhlaxmi@gmail.com
1, Ramchandra Smruti CHS, Gupte Road, Jaihind Colony
Dombivali west
Dombivli, Maharashtra 421202
India


