

Lab Plot n Fit

4.1star
27 reviews
500+
Downloads

Everyone
info


About this app
Are you a student pursuing a course in science or engineering? Do you have a hard time recording and analyzing all the data in your lab or practical class? Wouldn't it be great if you could make the smart phone in your pocket record, plot and analyze the data for you instead?
'Lab Plot n Fit' does just that and more. The android app can not only help you draw graphs of single and multi-set 2-dimensional numeric as well as time-series X-Y data with ease, but can also help you fit the data to a number of commonly encountered mathematical functions and also to any user defined function as well. You can then analyze the data just as you would do in the lab, without however having to use a graph paper or a computer and even without having to connect to the Internet.
With the 'Lab Plot n Fit' you can do a whole lot of things like:
* Enter your lab data row-wise or alternatively read in your entire data from a text data file (.txt, .dat or .csv) generated from MS Excel or other software programs and stored in your device's memory beforehand.
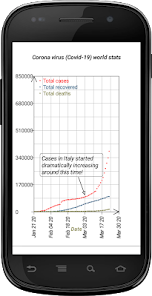
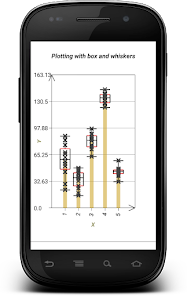
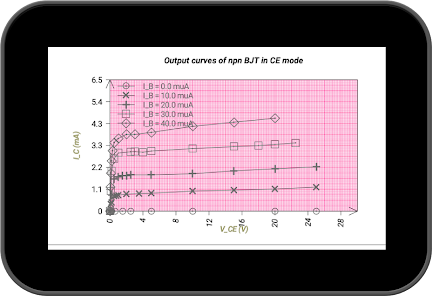
* Plot graphs of one or more number of data-sets by using a simple interface. Generate grids of different resolutions mimicking a conventional graph paper.
* Change axes ranges, change axes types, stretch or shrink the axes or shift the origin.
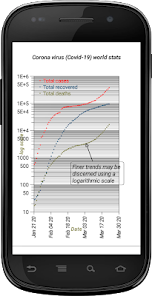
* Scale your axes to generate semi-log and even log-log graphs.
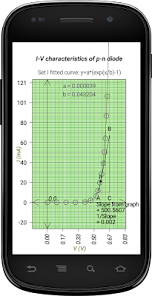
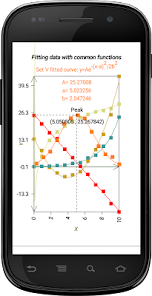
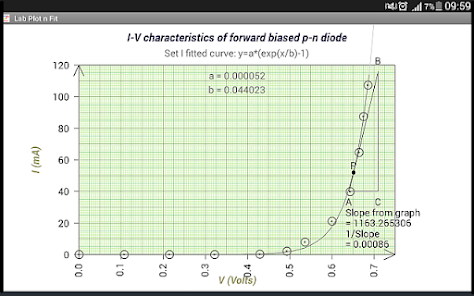
* Fit the whole or a portion of the graph for each data set to common mathematical functions and also to any user defined function , also using a simple interface.
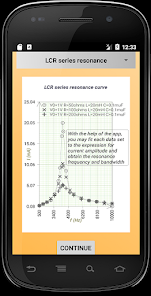
* Once the plotting and fitting is done, double tap on any point on the fitted curve to observe and display the corresponding X-Y point. Perform a slope calculation at that point by drawing a tangent and a right-angled triangle, just as you would do using a conventional graph paper. Also obtain Y value(s) at any X value and X value(s) at any Y value from the fitted curve.
* Save both the data as well as high resolution images of your displayed graph, both before and after fitting, to the device's memory.
* Retrieve the saved data at a later time by importing the saved data file into the app and then edit, plot and fit the data again.
* Add info like, your name, instructor's or teaching assistant's name, the name of the experiment the graph pertains to, and so on, to your graph image and data and send them as part of your lab assignment to your teacher or supervisor via email or WhatsApp, from right inside the app itself.
*And text and arrow annotations.
*And more.
Thanking you all,
Authors: A. Poddar and M. Poddar
abhidipt@hotmail.com
'Lab Plot n Fit' does just that and more. The android app can not only help you draw graphs of single and multi-set 2-dimensional numeric as well as time-series X-Y data with ease, but can also help you fit the data to a number of commonly encountered mathematical functions and also to any user defined function as well. You can then analyze the data just as you would do in the lab, without however having to use a graph paper or a computer and even without having to connect to the Internet.
With the 'Lab Plot n Fit' you can do a whole lot of things like:
* Enter your lab data row-wise or alternatively read in your entire data from a text data file (.txt, .dat or .csv) generated from MS Excel or other software programs and stored in your device's memory beforehand.
* Plot graphs of one or more number of data-sets by using a simple interface. Generate grids of different resolutions mimicking a conventional graph paper.
* Change axes ranges, change axes types, stretch or shrink the axes or shift the origin.
* Scale your axes to generate semi-log and even log-log graphs.
* Fit the whole or a portion of the graph for each data set to common mathematical functions and also to any user defined function , also using a simple interface.
* Once the plotting and fitting is done, double tap on any point on the fitted curve to observe and display the corresponding X-Y point. Perform a slope calculation at that point by drawing a tangent and a right-angled triangle, just as you would do using a conventional graph paper. Also obtain Y value(s) at any X value and X value(s) at any Y value from the fitted curve.
* Save both the data as well as high resolution images of your displayed graph, both before and after fitting, to the device's memory.
* Retrieve the saved data at a later time by importing the saved data file into the app and then edit, plot and fit the data again.
* Add info like, your name, instructor's or teaching assistant's name, the name of the experiment the graph pertains to, and so on, to your graph image and data and send them as part of your lab assignment to your teacher or supervisor via email or WhatsApp, from right inside the app itself.
*And text and arrow annotations.
*And more.
Thanking you all,
Authors: A. Poddar and M. Poddar
abhidipt@hotmail.com
Updated on
Safety starts with understanding how developers collect and share your data. Data privacy and security practices may vary based on your use, region, and age. The developer provided this information and may update it over time.

No data shared with third parties
Learn more about how developers declare sharing

No data collected
Learn more about how developers declare collection
Ratings and reviews
4.2
21 reviews

Kabita Barua
- Flag inappropriate
August 9, 2020
As always, this is yet another outstanding app for lab analysis work, from your team. Highly accurate and lots of useful features. This app is so accurate that it fits the exact polynomial function , even when only a few data values for (x , y) are given. This accuracy is the same as that with your other apps. Please continue with your project and please keep updating. For such nice and useful apps , many users (including myself) would be most glad to contribute (pay) for every updated version .
3 people found this review helpful
ABHIJIT PODDAR
November 8, 2020
Glad you found it useful. Please update to the latest version (if you haven't already) to use its newest features.

A Google user
- Flag inappropriate
- Show review history
February 10, 2020
This is quite frustrating. All I want is each unit on the Y axis to be a different sequential date, and a normal value on the X. I chose time-series, chose the simple format of "Jan 30" and inputted dates ranging from mid Jan to early Feb in the left with their appropriate value on the right. What came out was all points from Feb and Jan automatically switched in order with Feb plotted along X0 and Jan plotted along X(max) with a diagonal line connecting them to form a big "N". What even?
5 people found this review helpful
ABHIJIT PODDAR
February 14, 2020
There isn't any "Jan 30" date-time format available! You must have selected the "Jan 01" format. However, '01' represents YEAR (YY) and NOT day of month. Also, you must type Jan 01, Feb 05 etc & NOT Jan 1, Feb 5. For day of month, use: Jan 30 01, 30 Jan 01, Jan 30 2001 etc.
Make the changes & your graph would appear just as you would like it to :)

wesley lank
- Flag inappropriate
February 12, 2021
I need to plot often with just points, and after spending money on useless apps for my purchase, I stopped by here and found this to be the best fit. Thank you for the great app.
1 person found this review helpful
ABHIJIT PODDAR
February 14, 2021
Thanks for your review! Do recommend our app to your friends, and don’t hesitate to shoot us a note if you have any questions.
What's new
* App has now been made compatible with all new android versions.
* New user-interface has been used to import data from a file.
* New user-interface has been used to export data and graphs to files.
* Important bug fixes.
* The app has now been made available in English, German, Spanish, Portuguese, French, Bengali and Hindi.
* New user-interface has been used to import data from a file.
* New user-interface has been used to export data and graphs to files.
* Important bug fixes.
* The app has now been made available in English, German, Spanish, Portuguese, French, Bengali and Hindi.


