
Skew-t
4.3star
245 Rezensionen
10 Tsg.+
Downloads

Jedes Alter
info

Über diese App
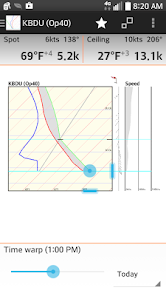
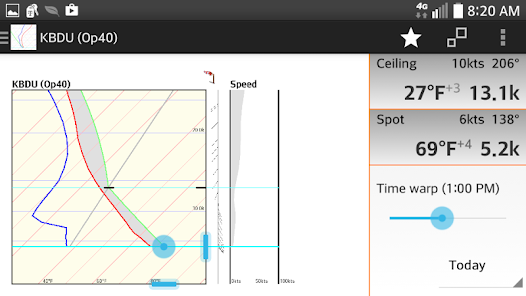
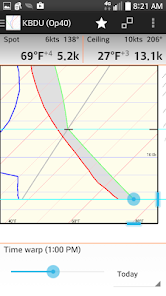
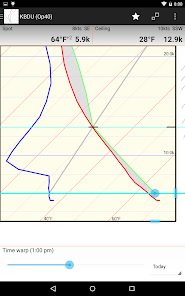
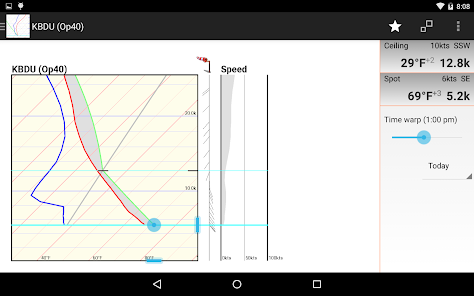
Skew-T Log-P diagrams are commonly used for weather analysis and forecasting. They graph weather balloon data to show the vertical profile of the temperature and dew point through the atmosphere.
See the following Finger Lakes Soaring Club web link for a great article describing how glider pilots use skew-t graphs to predict weather for a days flight.
http://www.flsc.org/portals/12/PDF/Read_Skew_T.pdf
Features:
Uses data from http://rucsoundings.noaa.gov/
Automatically download the day's weather data
Use the slider to quickly view all hour-by-hour graphs.
Zoom to inspect the graph details
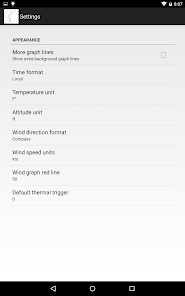
Configurable units and graph lines
Use different weather models
Show forecast graphs for the next few days
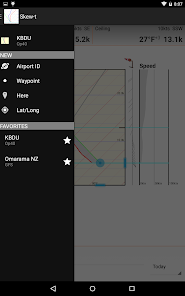
Saved favorites to quickly view different locations and/or weather models.
Here mode uses GPS to easily get graphs for your current location.
Load waypoints from files.
See the following Finger Lakes Soaring Club web link for a great article describing how glider pilots use skew-t graphs to predict weather for a days flight.
http://www.flsc.org/portals/12/PDF/Read_Skew_T.pdf
Features:
Uses data from http://rucsoundings.noaa.gov/
Automatically download the day's weather data
Use the slider to quickly view all hour-by-hour graphs.
Zoom to inspect the graph details
Configurable units and graph lines
Use different weather models
Show forecast graphs for the next few days
Saved favorites to quickly view different locations and/or weather models.
Here mode uses GPS to easily get graphs for your current location.
Load waypoints from files.
Aktualisiert am
Was die Sicherheit angeht, solltest du nachvollziehen, wie Entwickler deine Daten erheben und weitergeben. Die Datenschutz- und Sicherheitspraktiken können je nach Verwendung, Region und Alter des Nutzers variieren. Diese Informationen wurden vom Entwickler zur Verfügung gestellt und können jederzeit von ihm geändert werden.

Keine Daten werden mit Drittunternehmen oder -organisationen geteilt

Keine Daten erhoben
Bewertungen und Rezensionen
4.4
224 Rezensionen
Neuigkeiten
Android version update