
Stock Trender
Contains ads
100+
Downloads

Everyone
info


About this app
It's like having a personal stock advisor giving you tips on when to buy or sell!
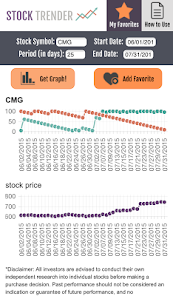
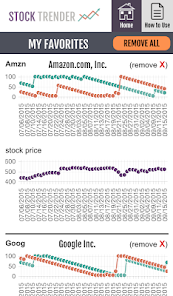
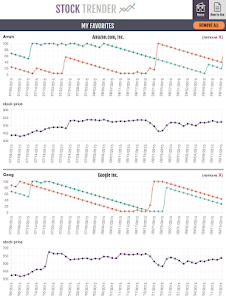
Using easy to read graphs, you'll be able to quickly spot stock trends:
It uses a time tested formula to statistically predict the best time to buy or sell a stock, or get in or out of the market in general.
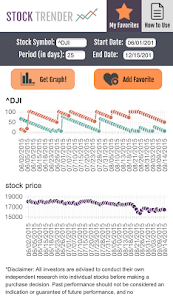
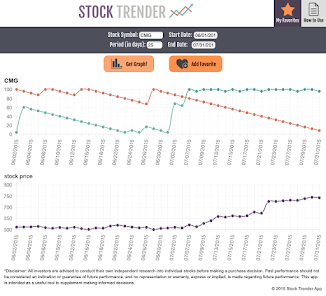
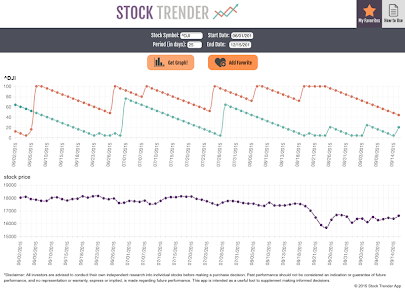
The formula calculates how the stock is trending. The green line displays how likely it is to continue to rise. The red line predicts how likely it is to continue to fall.
The key is to buy when the green line jumps to 100 AND crosses the red line
or sell when the red line jumps to 100 AND crosses the green line.
PLEASE NOTE: There's no guarantees in the market, it's predicting what's most likely to happen.
But it's been historically very accurate in making correct predictions.
Use it as a tool to supplement informed decisions on your stock trades!
Using easy to read graphs, you'll be able to quickly spot stock trends:
It uses a time tested formula to statistically predict the best time to buy or sell a stock, or get in or out of the market in general.
The formula calculates how the stock is trending. The green line displays how likely it is to continue to rise. The red line predicts how likely it is to continue to fall.
The key is to buy when the green line jumps to 100 AND crosses the red line
or sell when the red line jumps to 100 AND crosses the green line.
PLEASE NOTE: There's no guarantees in the market, it's predicting what's most likely to happen.
But it's been historically very accurate in making correct predictions.
Use it as a tool to supplement informed decisions on your stock trades!
Updated on
Safety starts with understanding how developers collect and share your data. Data privacy and security practices may vary based on your use, region, and age. The developer provided this information and may update it over time.

No data shared with third parties
Learn more about how developers declare sharing

No data collected
Learn more about how developers declare collection
What's new
v2.4
-Changed to ad supported free app due to recurring monthly costs of third party financial API
-SDK update
-Changed to ad supported free app due to recurring monthly costs of third party financial API
-SDK update