아임차트
100+
Downloads

Everyone
info


About this app
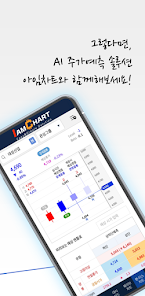
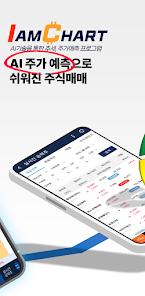
Now, the stock trading is also predicted by AI technology. I'm Chart using big data
It is a trading solution that predicts trends, stock prices and candles.
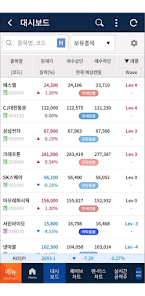
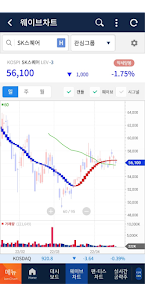
the wave chart
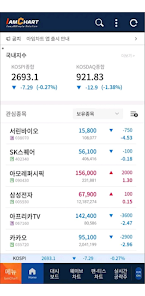
- Trends of indices and stocks are expressed in blocks, and it is optimized for medium and long-term trading.
- Depending on the color of the block, red is an uptrend and blue is a downtrend, and the size of the block expresses its strength.
- It supports a powerful trend search function, so you can discover items that are trending.
* Advantages
- You can work and invest at the same time without looking into the market every day & all day.
- We conduct realistic buys and sells reflecting market trends, not subjective target prices.
- You can read essential trends in asset management for mid- to long-term standard investment.
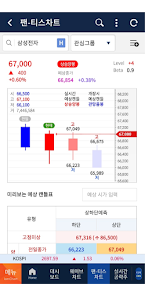
The fan-teas chart is,
- Predict today's highs, lows and candles of indices and stocks. Perfect for day trading.
- Before the opening, you can predict high and low prices through the expected market price. By placing a trade in advance, you can preempt a favorable price.
- After the opening, you can predict stock prices and candles in real time, allowing strategic response trading.
* Advantages
- With forecast prices and candles coming out, you can aim for a stable profit every day without chasing impulse trading.
- Through split trading, you can manage your funds rationally and trade without worrying.
A word from the developer – as a solution that has been verified for stability and profitability for day trading,
We publish market conditions and actual results every day on YouTube.
You can verify by using the trial/free service directly and experience the actual profit of AI prediction technology yourself.
Homepage: http://iamchart.com
YouTube: https://www.youtube.com/c/I'm Stock TV
[Inquiries and Contacts]
1661-3165
iamchart@esplanit.com
It is a trading solution that predicts trends, stock prices and candles.
the wave chart
- Trends of indices and stocks are expressed in blocks, and it is optimized for medium and long-term trading.
- Depending on the color of the block, red is an uptrend and blue is a downtrend, and the size of the block expresses its strength.
- It supports a powerful trend search function, so you can discover items that are trending.
* Advantages
- You can work and invest at the same time without looking into the market every day & all day.
- We conduct realistic buys and sells reflecting market trends, not subjective target prices.
- You can read essential trends in asset management for mid- to long-term standard investment.
The fan-teas chart is,
- Predict today's highs, lows and candles of indices and stocks. Perfect for day trading.
- Before the opening, you can predict high and low prices through the expected market price. By placing a trade in advance, you can preempt a favorable price.
- After the opening, you can predict stock prices and candles in real time, allowing strategic response trading.
* Advantages
- With forecast prices and candles coming out, you can aim for a stable profit every day without chasing impulse trading.
- Through split trading, you can manage your funds rationally and trade without worrying.
A word from the developer – as a solution that has been verified for stability and profitability for day trading,
We publish market conditions and actual results every day on YouTube.
You can verify by using the trial/free service directly and experience the actual profit of AI prediction technology yourself.
Homepage: http://iamchart.com
YouTube: https://www.youtube.com/c/I'm Stock TV
[Inquiries and Contacts]
1661-3165
iamchart@esplanit.com
Updated on
Safety starts with understanding how developers collect and share your data. Data privacy and security practices may vary based on your use, region, and age. The developer provided this information and may update it over time.

No data shared with third parties
Learn more about how developers declare sharing

No data collected
Learn more about how developers declare collection
What's new
내부 기능중 일부분이 개선되었습니다.