
SciChart Demo


Everyone
info
1K+
Downloads

Everyone
Learn more


About this app
This examples demo showcases SciChart Android Features and the flexibility of our API.
We have created a number of examples that may also serve you as a learning example.
They include a set of basic chart types, both 2D and 3D, ranging from simple 2D Android line, mountain and scatter chart to more advanced Android 3D meshes and waterfalls graphs.
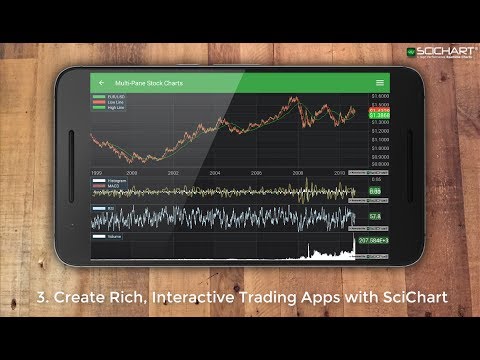
The demo example includes realtime charts, to show case the speed and performance of the library, as in most cases it is used for realtime data visualization from sensors, for example. Those examples include but are not limited to realtime ticking stock chart demos and realtime geoid meshes 3D simulations.
In SciChart you can create reach and interactive applications, we show here how to add interactivity like tooltips, rollovers and labels to your charts, allowing you to pan and zoom, change camera settings.
Each of these functionalities has an independent example created.
Finally, SciChart ships with 8 themes out of the box, ability to create your own theme or to style every element of the chart independently, allowing to get the look and feel of your charting components just as you need it.
We have created a number of examples that may also serve you as a learning example.
They include a set of basic chart types, both 2D and 3D, ranging from simple 2D Android line, mountain and scatter chart to more advanced Android 3D meshes and waterfalls graphs.
The demo example includes realtime charts, to show case the speed and performance of the library, as in most cases it is used for realtime data visualization from sensors, for example. Those examples include but are not limited to realtime ticking stock chart demos and realtime geoid meshes 3D simulations.
In SciChart you can create reach and interactive applications, we show here how to add interactivity like tooltips, rollovers and labels to your charts, allowing you to pan and zoom, change camera settings.
Each of these functionalities has an independent example created.
Finally, SciChart ships with 8 themes out of the box, ability to create your own theme or to style every element of the chart independently, allowing to get the look and feel of your charting components just as you need it.
Updated on
Safety starts with understanding how developers collect and share your data. Data privacy and security practices may vary based on your use, region, and age. The developer provided this information and may update it over time.

No data shared with third parties
Learn more about how developers declare sharing

No data collected
Learn more about how developers declare collection
What’s new
- New Axis Borders API for improved axis customization
- New IncludeAxis API for better control over axis rendering
- Added TradeMarkerAnnotation to enhance trade visualization
- New IncludeAxis API for better control over axis rendering
- Added TradeMarkerAnnotation to enhance trade visualization
Everyone
Learn moreApp support
About the developer
SCICHART LIMITED
support@scichart.com
Suite 16 Beaufort Court, Admirals Way
LONDON
E14 9XL
United Kingdom
+44 7745 520158