
InfluxDB Widgets


Everyone
info
1+
Downloads

Everyone
Learn more


About this app
Sensor Widgets brings the measurements from your own time-series database directly to your home screen: temperature, humidity, CO2, particulate matter, power consumption, or any other value you store in InfluxDB.
The app is the control center for your widgets. The widgets themselves are native and retrieve their data independently in the background—the app doesn't need to be running.
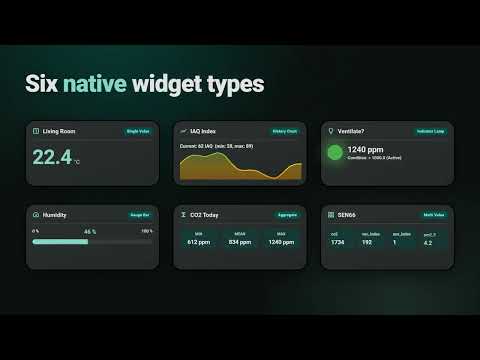
SIX WIDGET TYPES
• Single Value – the current measurement with unit, decimal places, and status colors
• History – graph from 1 hour to 30 days, with color gradient, area, grid, and axes
• Indicator Light – illuminates as soon as a threshold is exceeded or fallen below
• Bar/Level – value between minimum and maximum
• Aggregate – minimum, average, and maximum over a period
• Multi-Value – several fields compactly in a table, e.g., B. All values from a room sensor
EASY SETUP
• Multiple connections: InfluxDB Cloud and self-hosted instances (v1, v2, v3 via the v1-compatible API)
• Connection test before saving
• Measurements, fields, and tags are automatically suggested – or you can type them in manually
• Live preview with real data before the widget appears on the home screen
• Widget size is freely adjustable; the content scales accordingly
• Appearance per widget: background, transparency, text and accent color, font size, corner radius
FORMULAS
Calculate values from multiple fields before they are displayed: + − * /, comparisons, if, min, max, clamp, abs, round, pow, sqrt, and more, with named intermediate steps. Templates such as an Air Quality Index (IAQ) for the Sensirion SEN66 help you get started. Trends and aggregates are also calculated for each time period.
NOTIFICATIONS
Optionally, a widget can notify you when a value exceeds a threshold—for example, "Ventilate, CO2 over 1000 ppm." The notification is generated locally on the device, without a push server.
PRIVACY
• No dedicated server, no account, no advertising, no tracking
• The app communicates directly with the database you specify
• API tokens are encrypted and stored securely on the device
• The app only reads—it does not write to your database
OPEN SOURCE
Sensor Widgets is open source (MIT license). Source code, instructions, and error messages: github.com/SphaeroX/sensor-widgets
Note: You need your own InfluxDB instance (cloud or self-hosted) with read access via API token. Widgets update at the system's regular interval (approximately every 15–30 minutes) or by tapping the up arrow.
InfluxDB is a trademark of InfluxData Inc. This app is an independent project and is not affiliated with InfluxData.
The app is the control center for your widgets. The widgets themselves are native and retrieve their data independently in the background—the app doesn't need to be running.
SIX WIDGET TYPES
• Single Value – the current measurement with unit, decimal places, and status colors
• History – graph from 1 hour to 30 days, with color gradient, area, grid, and axes
• Indicator Light – illuminates as soon as a threshold is exceeded or fallen below
• Bar/Level – value between minimum and maximum
• Aggregate – minimum, average, and maximum over a period
• Multi-Value – several fields compactly in a table, e.g., B. All values from a room sensor
EASY SETUP
• Multiple connections: InfluxDB Cloud and self-hosted instances (v1, v2, v3 via the v1-compatible API)
• Connection test before saving
• Measurements, fields, and tags are automatically suggested – or you can type them in manually
• Live preview with real data before the widget appears on the home screen
• Widget size is freely adjustable; the content scales accordingly
• Appearance per widget: background, transparency, text and accent color, font size, corner radius
FORMULAS
Calculate values from multiple fields before they are displayed: + − * /, comparisons, if, min, max, clamp, abs, round, pow, sqrt, and more, with named intermediate steps. Templates such as an Air Quality Index (IAQ) for the Sensirion SEN66 help you get started. Trends and aggregates are also calculated for each time period.
NOTIFICATIONS
Optionally, a widget can notify you when a value exceeds a threshold—for example, "Ventilate, CO2 over 1000 ppm." The notification is generated locally on the device, without a push server.
PRIVACY
• No dedicated server, no account, no advertising, no tracking
• The app communicates directly with the database you specify
• API tokens are encrypted and stored securely on the device
• The app only reads—it does not write to your database
OPEN SOURCE
Sensor Widgets is open source (MIT license). Source code, instructions, and error messages: github.com/SphaeroX/sensor-widgets
Note: You need your own InfluxDB instance (cloud or self-hosted) with read access via API token. Widgets update at the system's regular interval (approximately every 15–30 minutes) or by tapping the up arrow.
InfluxDB is a trademark of InfluxData Inc. This app is an independent project and is not affiliated with InfluxData.
Display sensor data from your InfluxDB as native widgets on the home screen.
Updated on
Safety starts with understanding how developers collect and share your data. Data privacy and security practices may vary based on your use, region, and age. The developer provided this information and may update it over time.
- No data shared with third partiesLearn more about how developers declare sharing
- No data collectedLearn more about how developers declare collection


