Debuggable Browser
2,8star
193 avis
10K+
Téléchargements

Tout public
info


À propos de l'application
What is it?
Just a debug-enabled WebView, allowing you to use Chrome's Developer Tools (running on your PC or Mac) to inspect and debug your web app while its running on your actual device.
Aimed only for web developers and web designers
This app was built for web developers who aim to deliver the best user experience of their web app to Android users. If you're not a web developer or web designer interested in debugging web apps, then you're likely better of with a normal browser ;)
What's the use of it?
If you ever opened your web site in the Android stock browser and encountered one of the following issues, this app might prove useful to you:
• The layout or styling of your web site appears broken when viewed in the Android stock browser
• Your JavaScript code didn't produce the expected result or the computation must have suddenly stopped during execution (maybe an exception was thrown?)
• Animations are laggy or just don't animate as expected
Description
It sometimes happens that a web app doesn't work on mobile browsers, even though it's working fine on desktop browsers. Even worse, sometimes defects occur only on (certain) mobile devices, so you cannot simulate and reproduce it on a desktop browser. This is where remote debugging with Chrome's DevTools proves to be useful. While Chrome for Android perfectly supports this already, the Android stock browser doesn't. This is unfortunate, since a lot of Android bugs seem to occur only on the stock browser and not on Chrome anyways.
So this app lets you run web sites within the native browser (WebView), while giving you the possibility to inspect and debug the page with the Chrome DevTools.
How to start remote debugging?
1. Enable Developer Mode on your Android device and connect it to your PC/Mac
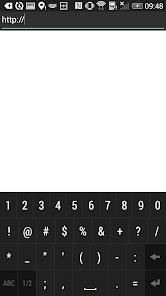
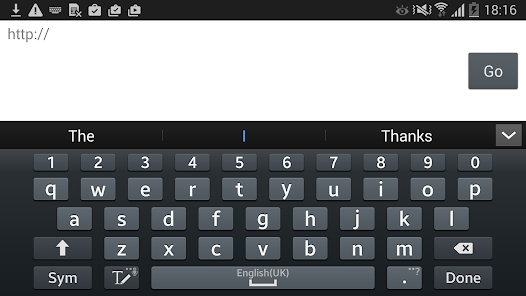
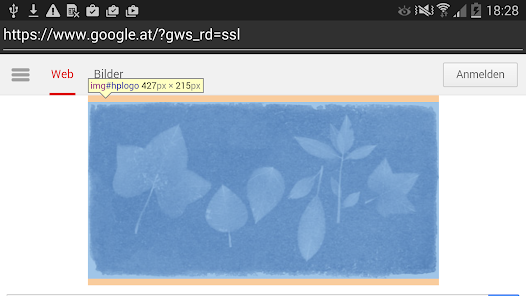
2. Open this app and navigate to your web site by entering its URL
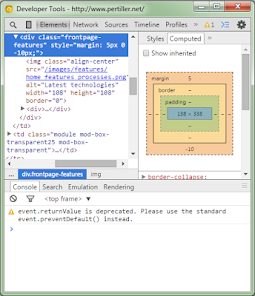
3. On your PC/Mac, open Chrome and type "chrome://inspect" into the address bar
4. In Chrome, check "Discover USB Devices" and it will list the web page you've opened on your device
5. Hit inspect and enjoy remote debugging the app with the Chrome Developer Tools
For more information, read: https://www.pertiller.tech/blog/remote-debugging-the-android-native-browser
Just a debug-enabled WebView, allowing you to use Chrome's Developer Tools (running on your PC or Mac) to inspect and debug your web app while its running on your actual device.
Aimed only for web developers and web designers
This app was built for web developers who aim to deliver the best user experience of their web app to Android users. If you're not a web developer or web designer interested in debugging web apps, then you're likely better of with a normal browser ;)
What's the use of it?
If you ever opened your web site in the Android stock browser and encountered one of the following issues, this app might prove useful to you:
• The layout or styling of your web site appears broken when viewed in the Android stock browser
• Your JavaScript code didn't produce the expected result or the computation must have suddenly stopped during execution (maybe an exception was thrown?)
• Animations are laggy or just don't animate as expected
Description
It sometimes happens that a web app doesn't work on mobile browsers, even though it's working fine on desktop browsers. Even worse, sometimes defects occur only on (certain) mobile devices, so you cannot simulate and reproduce it on a desktop browser. This is where remote debugging with Chrome's DevTools proves to be useful. While Chrome for Android perfectly supports this already, the Android stock browser doesn't. This is unfortunate, since a lot of Android bugs seem to occur only on the stock browser and not on Chrome anyways.
So this app lets you run web sites within the native browser (WebView), while giving you the possibility to inspect and debug the page with the Chrome DevTools.
How to start remote debugging?
1. Enable Developer Mode on your Android device and connect it to your PC/Mac
2. Open this app and navigate to your web site by entering its URL
3. On your PC/Mac, open Chrome and type "chrome://inspect" into the address bar
4. In Chrome, check "Discover USB Devices" and it will list the web page you've opened on your device
5. Hit inspect and enjoy remote debugging the app with the Chrome Developer Tools
For more information, read: https://www.pertiller.tech/blog/remote-debugging-the-android-native-browser
Date de mise à jour
La sécurité, c'est d'abord comprendre comment les développeurs collectent et partagent vos données. Les pratiques concernant leur confidentialité et leur protection peuvent varier selon votre utilisation, votre région et votre âge. Le développeur a fourni ces informations et peut les modifier ultérieurement.

Aucune donnée partagée avec des tiers
En savoir plus sur la manière dont les développeurs déclarent le partage

Aucune donnée collectée
En savoir plus sur la manière dont les développeurs déclarent la collecte
Notes et avis
3,0
181 avis
Nouveautés
Integrated your feedback
- It's been exactly 1 year since the last release and I noticed that this app led to some confusion for a lot of people that misunderstood its use-case: it's built for web developers who want to optimize their web app with the power of Chrome's dev tools while running the page on an actual Android device (see updated notes).
- Besides, I got some lovely suggestions. So now you can start the app as intent from another app to start debugging a weblink right away!
Assistance de l'appli
À propos du développeur
David Georg Pertiller MMsc
david@pertiller.tech
Baumeistergasse 88A/Parz. 4
1160 Wien
Austria
+43 699 11061597


