If you use www.pvoutput.org then this app is for you!
See the Getting Started guide at http://pvoutputapp.mcdonalds.id.au/
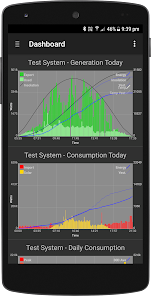
General features include: - Pull out the navigation draw from the left. - Search for and Add any System or Team from pvoutput.org. - Build your own dashboard with your favourite graphs. Click on the dashboard graphs to jump to the system page.
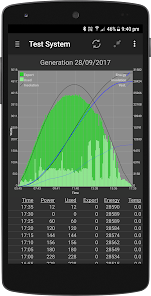
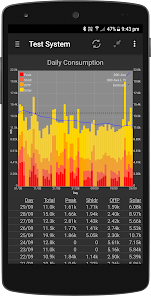
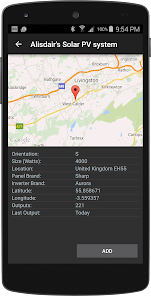
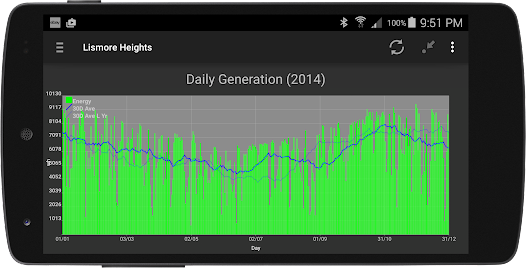
System Pages: - Intraday, Daily, Weekly, Monthly and Yearly system pages. - Swipe left/right to move between Intradays, Daily, Weekly, Monthly and Yearly graphs. - Swipe up/down to move between Generation, Consumption, Import/Export kWH, Import/Export Monetary and Extended Data. - Use menu on the system page to Add to Dashboard, View/Edit System Details, Edit TOU Tariffs, manually add outputs, refresh all data or delete the system from the app. - Portrait shows graph and data grid. Click on data heading to hide the graph to view data list in full screen. Click heading line again to restore the graph. - Rotate to landscape to see full screen graph. - Drill using a list click or long press.
System Pages Drill Mode: - Indicated by drill period in round brackets in page heading. - When in drill mode, swipe left/right to move period. eg: move from month to month, year to year etc. - Use the back button to exit Drill Mode. - Access Drill Mode via list click or long press.
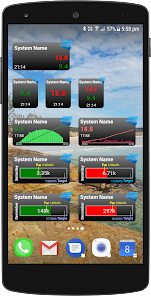
Home Screen Widgets: - Keep informed by nice homescreen widgets. - A basic 1x1 text widget for free. - In-app subscription (7 day free trial) for additional Text, Graph and Progress Bar home screen widget options. - Place a 2x1, resize and then adjust the width/height via the widget configuration screen. - Click on the system name to re-enter the widget configuration screen. - Click on the widget to enter the app.
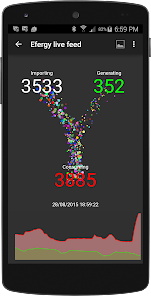
Live Feeds: - Be mesmerised by the animated dots that represent electricity flowing between the grid (import or export) your solar panel generation and your household comsumption. - In-app subscription (7 day free trial). - Great for an in-home display to help your family visualise their real-time power consumption and reduce those bills. Cook some toast and watch those dots fly! - Currently supports Efergy (Energyhive), VeraLite, SolarEdge and Fronius.
Access to pvoutput.org data is governed by the pvoutput.org API limits and restrictions. If your system has access to the API bonus features, this app can take advantage of higher rate limits and retrieve detail data for other systems.
Don't hesitate to drop me an email (pvoutput@mcdonalds.id.au) with any problems or suggestions.
Updated on
Jan 17, 2022
Tools
Data safety
arrow_forward
Safety starts with understanding how developers collect and share your data. Data privacy and security practices may vary based on your use, region, and age. The developer provided this information and may update it over time.
This app may share these data types with third parties
App activity and Device or other IDs
No data collected
Learn more about how developers declare collection
Data is encrypted in transit
Data can’t be deleted
See details
'> -->
Not Found
We're sorry, the requested URL was not found on this server.