The Parabolic Stop and Reverse (SAR) is a simple technical indicator created by Welles Wilder. This trend following indicator is based on the idea that a strong trend will continue to increase in strength over time, following a parabolic arc. It uses a combination of price and time components to generate buy and sell signals.
The parabolic SAR is typically shown on the charts as a series of small 'dots' that are placed either above or below the price. When the price is trending to the upside, the dots are below the price action and when the price is trending to the downside, the dots are above the price action. It trails the price movement until the price move has finished and begins to reverse.
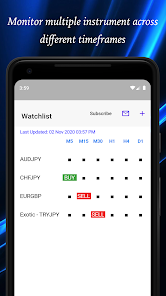
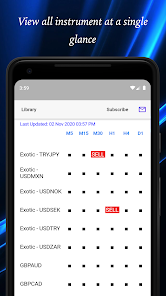
A BUY signal is generated when the Parabolic SAR moves from being above price to below price and likewise a SELL signal is generated when the Parabolic SAR moves from being below price to above price.
Like any other indicators, Easy PSAR should not be used as a standalone indicator for making your trade decision but as a reference to spot potential trade opportunity.
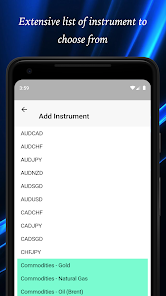
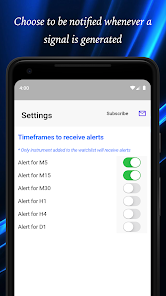
Easy PSAR provides a comprehensive dashboard that allows you to view the BUY/SELL signals of many popular instruments across multiple timeframes (M5, M15, M30, H1, H4, D1) at one glance. (Please note that M5 is only available for viewing as an optional in-app subscription) In this way, you do not miss out any trading opportunities even on the go.
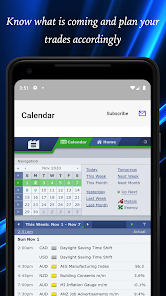
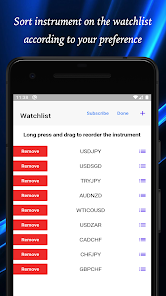
Below are some of the key features of the app. - Timely display of BUY/SELL signals from the parabolic SAR strategy of over 60 instruments across 6 timeframes, - Timely push notification alert when BUY/SELL signals are generated based on your favourite instruments on your watchlist, - Display headline news of your favourite instruments
Read about our Privacy Policy here: http://easyindicators.com/privacy.html Read about our Terms of Use here: http://easyindicators.com/terms.html
To learn more about us and our products, please visit www.easyindicators.com .
All feedback and suggestions are welcome. You can submit them via the portal below. https://feedback.easyindicators.com
Otherwise, you can reach us via email (support@easyindicators.com) or the contact feature within the app.
Join our facebook fan page. http://www.facebook.com/easyindicators Follow us on Twitter (@EasyIndicators)
*** IMPORTANT NOTE *** Please note that updates are not available during weekend.
Disclaimer/Disclosure
EasyIndicators has taken great measures to ensure the accuracy and timeliness of the information in the application, however, does not guarantee its accuracy and timeliness, and will not accept liability for any loss or damage, including without limitation to, any loss of profit, which may arise directly or indirectly from the use of or reliance on such information, inability to access the information, for any delay in or failure of the transmission or the receipt of any instruction or notifications sent through this application.
The Application Provider (EasyIndicators) reserves the rights to stop the service without any advance notification.
Updated on
Aug 14, 2023
Finance
Data safety
arrow_forward
Safety starts with understanding how developers collect and share your data. Data privacy and security practices may vary based on your use, region, and age. The developer provided this information and may update it over time.