Accelerometer Meter
4.2star
828 reviews
100K+
Downloads

Everyone
info


About this app
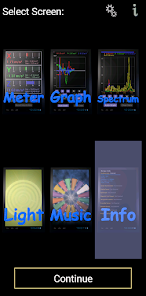
View or log output from your accelerometer sensor. The app has six screens to choose from:
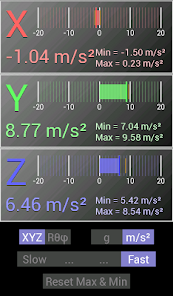
Meter
This show the output from the accelerometer and minimum and maximum vales recorded.
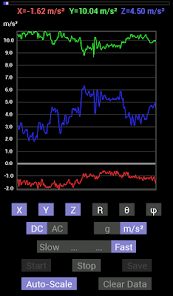
Graph
Plots the accelerometer output over time. Option to save data.
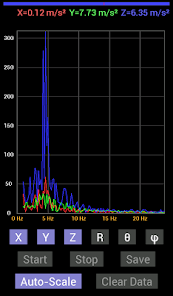
Spectrum
Shows the frequency spectrum of the recent accelerometer data. Use to find resonant frequency's.
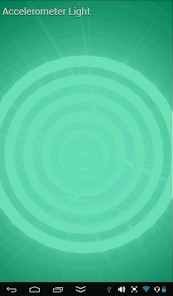
Light
Converts the accelerometer sensor output into a colour. Wave the device around and the colour will change.
Music
This is a musical instrument based on the accelerometer sensor. Orientation selects the note and pitch the volume. It is based on a 5 equal temperament notes per octave scale so that the music will still sound reasonable even if played badly.
Info
This screen provides info on your sensor, such as vendor, version, resolution and range. It also shows info for other sensors on your device.
Write external storage permission so that you can save the data in graph or spectrum modes.
Meter
This show the output from the accelerometer and minimum and maximum vales recorded.
Graph
Plots the accelerometer output over time. Option to save data.
Spectrum
Shows the frequency spectrum of the recent accelerometer data. Use to find resonant frequency's.
Light
Converts the accelerometer sensor output into a colour. Wave the device around and the colour will change.
Music
This is a musical instrument based on the accelerometer sensor. Orientation selects the note and pitch the volume. It is based on a 5 equal temperament notes per octave scale so that the music will still sound reasonable even if played badly.
Info
This screen provides info on your sensor, such as vendor, version, resolution and range. It also shows info for other sensors on your device.
Write external storage permission so that you can save the data in graph or spectrum modes.
Updated on
Safety starts with understanding how developers collect and share your data. Data privacy and security practices may vary based on your use, region, and age. The developer provided this information and may update it over time.

No data shared with third parties
Learn more about how developers declare sharing

This app may collect these data types
App info and performance

Data is encrypted in transit

Data can’t be deleted