
Ally Science
5K+
Downloads

Everyone
info

About this app
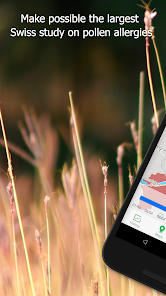
Join the Ally Science community and contribute your anonymised data to Switzerland's biggest study on pollen allergy. Do you suffer from allergic reactions when the pollen season comes around each year? If so, you are certainly not alone. Nevertheless, not enough is known about how many people in Switzerland are affected, where they are and how severe their symptoms are. Do town or country dwellers suffer more? Are there any regional differences in symptoms? Are certain combinations of allergies more aggressive than others? Is weather a bigger factor than we previously thought? The combined anonymised data of the app users, who span every region in Switzerland – mountains, valleys, town, country, north, south, east and west – will make a vital contribution towards a better understanding of pollen allergy in Switzerland. The ultimate aim is to establish more effective treatments.
Use the app to keep a diary and benefit from the features of the Ally Science app.
Diary and other features
- Welcome to the Ally Science community! Start by creating your profile, including details of which pollen allergies affect you, if known.
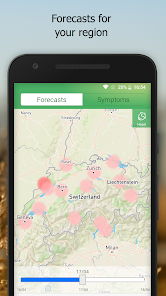
- Pollen forecast for your profile in your region. You can see how pollen exposure is expected to develop over the next three days in the locations where you spend the most time.
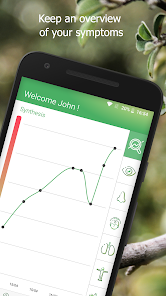
- How are you feeling today? The animated graphic provides a visual representation of your current symptoms.
- Where are you? In addition to the three locations where you spend most of your time, you can add extra short-term locations, for instance, if you are going on a day trip or holiday.
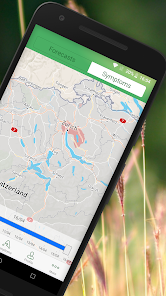
- How the Ally community is feeling at the moment. You can make use of the data generated by all the app users. The Ally symptom map shows you how fellow allergy sufferers in your region are feeling right now.
- How was last week? Using the calendar, you can review how severe your symptoms were the previous week.
- How is the Ally Science community feeling? You can see in real time how severe the symptoms of app users in your region are. This "symptom map" can also be used to look up data from the past week.
- No consultation hours. Although leading Swiss allergists from University Hospital Zurich are heading up the study based on the Ally Science anonymised data, they have no access to your data and do not offer any personal medical advice.
- Got a question? If, however, you have a medical question or want to know more about the study, you can send an e-mail to info@allyscience.ch and we will get back to you.
- Your language: Ally Science speaks your language. The app is available in the following languages: Romansh, Italian, French, German and English.
- Your data: Your data is saved on your personal account on the MIDATA platform and, with your consent, is then anonymised and pooled with other users' data and incorporated into the study. Once the study is complete, your data from Ally Science remains on your MIDATA account as your property.
The Ally Science app lays the foundation for other studies investigating pollen allergies. The app has been designed by the Institute for Medical Informatics I4MI in Biel, part of Bern University of Applied Sciences BFH. It has been brought to fruition through a collaboration with technology partner ELCA and graphic and design partner Superhuit. Dyson is also supporting the project as an industry partner.
Ally Science obtains pollen reports from MeteoSwiss – the Federal Office for Meteorology and Climatology
Use the app to keep a diary and benefit from the features of the Ally Science app.
Diary and other features
- Welcome to the Ally Science community! Start by creating your profile, including details of which pollen allergies affect you, if known.
- Pollen forecast for your profile in your region. You can see how pollen exposure is expected to develop over the next three days in the locations where you spend the most time.
- How are you feeling today? The animated graphic provides a visual representation of your current symptoms.
- Where are you? In addition to the three locations where you spend most of your time, you can add extra short-term locations, for instance, if you are going on a day trip or holiday.
- How the Ally community is feeling at the moment. You can make use of the data generated by all the app users. The Ally symptom map shows you how fellow allergy sufferers in your region are feeling right now.
- How was last week? Using the calendar, you can review how severe your symptoms were the previous week.
- How is the Ally Science community feeling? You can see in real time how severe the symptoms of app users in your region are. This "symptom map" can also be used to look up data from the past week.
- No consultation hours. Although leading Swiss allergists from University Hospital Zurich are heading up the study based on the Ally Science anonymised data, they have no access to your data and do not offer any personal medical advice.
- Got a question? If, however, you have a medical question or want to know more about the study, you can send an e-mail to info@allyscience.ch and we will get back to you.
- Your language: Ally Science speaks your language. The app is available in the following languages: Romansh, Italian, French, German and English.
- Your data: Your data is saved on your personal account on the MIDATA platform and, with your consent, is then anonymised and pooled with other users' data and incorporated into the study. Once the study is complete, your data from Ally Science remains on your MIDATA account as your property.
The Ally Science app lays the foundation for other studies investigating pollen allergies. The app has been designed by the Institute for Medical Informatics I4MI in Biel, part of Bern University of Applied Sciences BFH. It has been brought to fruition through a collaboration with technology partner ELCA and graphic and design partner Superhuit. Dyson is also supporting the project as an industry partner.
Ally Science obtains pollen reports from MeteoSwiss – the Federal Office for Meteorology and Climatology
Updated on
Data safety
Developers can show information here about how their app collects and uses your data. Learn more about data safety

No information available
What's new
What's new in Ally Science version 2019? Nothing less than a world first: the measurement and display of the pollen load live, using the Swisens startup's measuring devices.
And to make sure you don't forget to enter your symptoms, we've included a reminder function. Soon, you will be able to generate a PDF of your symptom history and compare the data entered in 2018 with those from 2019.
And to make sure you don't forget to enter your symptoms, we've included a reminder function. Soon, you will be able to generate a PDF of your symptom history and compare the data entered in 2018 with those from 2019.


