IoT Sensor Data
50+
Downloads

Everyone
info

About this app
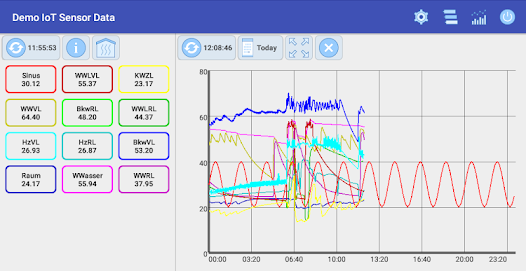
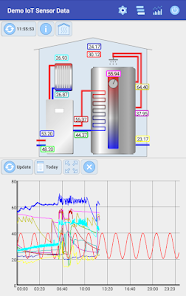
The application shows actual and recorded informations provided by a webserver. The actual data is displayed in a standard view or a graphical view. The graphical view displays svg which can be downloaded from a webserver. You can create and import your own svg’s. The recorded informations are displayed in graph view.
Primary this application is part of a smart home project for temperature monitoring with the ESP32. Have a look at the project page https://www.diy-temperature-logger.com
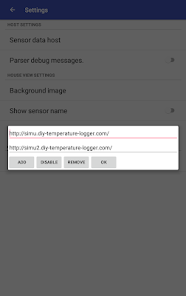
The appication can also be used for your own diy sensor monitoring project. The application fetch the actual and recorded data with two requests from a http webserver. For debugging purpose the app can display parsing errors of the interface.
Interface of actual data:
http://simu.diy-temperature-logger.com/config
1;esp-simulation;0.9;2018/11/20 11:46:23;33
1;721E;53.37;WWLVL;7;0;0;977
1;E4F6;23.27;KWZL;12;2;0;845
1;5364;66.4;WWVL;7;0;0;134
Interface of recorded data:
http://simu.diy-temperature-logger.com/file?y=2018&m=12&d=09&id=5364
00:01;47.25
00:02;47.38
0:03;48.13
The free demo can only access the webserver http://simu.diy-temperature-logger.com
In the standard application you can configure the webserver and fetch your own data. In the standard application it is also possible to fetch data from up to eight hosts.
Primary this application is part of a smart home project for temperature monitoring with the ESP32. Have a look at the project page https://www.diy-temperature-logger.com
The appication can also be used for your own diy sensor monitoring project. The application fetch the actual and recorded data with two requests from a http webserver. For debugging purpose the app can display parsing errors of the interface.
Interface of actual data:
http://simu.diy-temperature-logger.com/config
1;esp-simulation;0.9;2018/11/20 11:46:23;33
1;721E;53.37;WWLVL;7;0;0;977
1;E4F6;23.27;KWZL;12;2;0;845
1;5364;66.4;WWVL;7;0;0;134
Interface of recorded data:
http://simu.diy-temperature-logger.com/file?y=2018&m=12&d=09&id=5364
00:01;47.25
00:02;47.38
0:03;48.13
The free demo can only access the webserver http://simu.diy-temperature-logger.com
In the standard application you can configure the webserver and fetch your own data. In the standard application it is also possible to fetch data from up to eight hosts.
Updated on
Safety starts with understanding how developers collect and share your data. Data privacy and security practices may vary based on your use, region, and age. The developer provided this information and may update it over time.

No data shared with third parties
Learn more about how developers declare sharing

No data collected
Learn more about how developers declare collection
What’s new
downgrade to SDK35, set android:windowOptOutEdgeToEdgeEnforcement=false
App support
About the developer
Sebastian Hinz
diy.electronic.hinz@gmail.com
Pferdnerstieg 6c
22419 Hamburg
Germany


