
Databox: Modern BI Software

4.1star
280 reviews
50K+
Downloads

Everyone
info
About this app
the best of BI, without the complicated setup, steep price, or long learning curve.
It helps growing companies make their data more usable, by making it accessible to their entire team so they can make better decisions, faster.
It provides a blend of powerful, but easy-to-use features like:
- Connect all your data from 130+ software tools, APIs, Databases or custom Spreadsheets in seconds.
- Data prep (datasets) - Curate, prepare, and merge raw data from multiple sources, so your team can analyze with more depth, confidence, and clarity later.
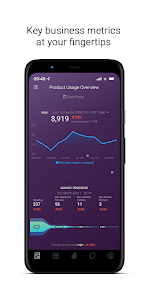
- Metrics & KPIs - Track all your company's metrics and KPIs in one place.
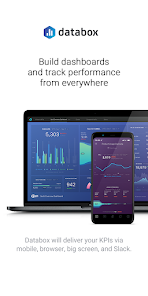
- Dashboards - Visualize performance in real-time with interactive
dashboards (custom or pre-built templates) you can share with anyone.
- Reports - Create custom presentations of your data that update automatically.
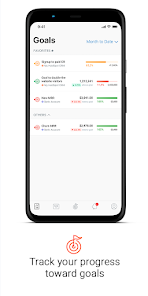
- Goals - Set realistic goals based on historical data, monitor your progress, then achieve them.
- Benchmark - Compare performance against similar companies to find gaps and opportunities to improve.
- Forecast - Forecast what future performance will be for any metric, and see the best and worst-case scenarios.
- AI-powered insights - Get AI-generated summaries of how you’re performing.
The atabox experience is built to support multiple devices and platforms so that you can access your data at any time, from wherever you like, mobile app, web, tv or smart watch.
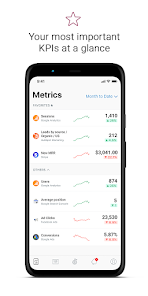
The mobile app is a beautifully designed dashboard which tells you when important things change in your business. From a morning briefing with a daily scorecard we'll make sure you start your day in the know to smart alerts which will notify you when something needs your attention Databox has you covered.
More than 20,000 growing businesses and agencies use Databox to align teams, save time, and inform predictable growth.
Try it today at databox.com
It helps growing companies make their data more usable, by making it accessible to their entire team so they can make better decisions, faster.
It provides a blend of powerful, but easy-to-use features like:
- Connect all your data from 130+ software tools, APIs, Databases or custom Spreadsheets in seconds.
- Data prep (datasets) - Curate, prepare, and merge raw data from multiple sources, so your team can analyze with more depth, confidence, and clarity later.
- Metrics & KPIs - Track all your company's metrics and KPIs in one place.
- Dashboards - Visualize performance in real-time with interactive
dashboards (custom or pre-built templates) you can share with anyone.
- Reports - Create custom presentations of your data that update automatically.
- Goals - Set realistic goals based on historical data, monitor your progress, then achieve them.
- Benchmark - Compare performance against similar companies to find gaps and opportunities to improve.
- Forecast - Forecast what future performance will be for any metric, and see the best and worst-case scenarios.
- AI-powered insights - Get AI-generated summaries of how you’re performing.
The atabox experience is built to support multiple devices and platforms so that you can access your data at any time, from wherever you like, mobile app, web, tv or smart watch.
The mobile app is a beautifully designed dashboard which tells you when important things change in your business. From a morning briefing with a daily scorecard we'll make sure you start your day in the know to smart alerts which will notify you when something needs your attention Databox has you covered.
More than 20,000 growing businesses and agencies use Databox to align teams, save time, and inform predictable growth.
Try it today at databox.com
Updated on
Safety starts with understanding how developers collect and share your data. Data privacy and security practices may vary based on your use, region, and age. The developer provided this information and may update it over time.

No data shared with third parties
Learn more about how developers declare sharing

This app may collect these data types
Personal info, App activity and 2 others

Data is encrypted in transit

You can request that data be deleted
Ratings and reviews
4.3
266 reviews

A Google user
- Flag inappropriate
July 29, 2019
the restrictions not enough...the goal setting can view by all the user...what is the point for the databoard access...can u fix this issue...or the goal setting also set the access for which user.
44 people found this review helpful

Nijo Daniel
- Flag inappropriate
June 1, 2020
Worst experience so far. After a certain period of time.. It automatically resets the entire metrics that you have painfully taken time to set up. Then after few days it literally shows no data whatsoever... Such a painful experience
60 people found this review helpful

Bobby Zio
- Flag inappropriate
April 9, 2022
Tried a number of times to log in. No go, one star. Sorry.
3 people found this review helpful
What’s new
Here's what's new with this version:
• Bug fixes and performance improvements
• Bug fixes and performance improvements
App support
About the developer
Databox Inc.
andrej@databox.com
6 Liberty Sq
Boston, MA 02109
United States
+386 31 541 603


