
APsystems EMA App
2.3star
2.47K reviewsinfo
100K+
Downloads

PEGI 3
info

About this app
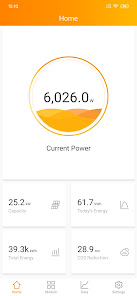
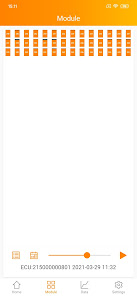
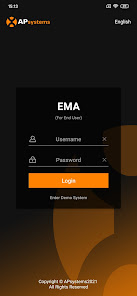
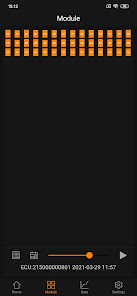
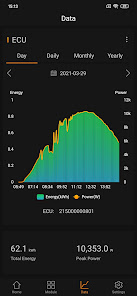
The Energy Monitoring and Analysis App allows APsystems microinverter system owners to track solar array performance in real time through their mobile device.
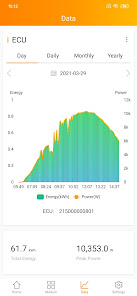
See system output by day, month, year and lifetime of the array, and calculate energy savings based on price per kilowatt hour.
The app also displays environmental savings in gallons of gasoline, trees and carbon emissions.
All data is displayed through an easy-to-use graphical interface.
See system output by day, month, year and lifetime of the array, and calculate energy savings based on price per kilowatt hour.
The app also displays environmental savings in gallons of gasoline, trees and carbon emissions.
All data is displayed through an easy-to-use graphical interface.
Updated on
Safety starts with understanding how developers collect and share your data. Data privacy and security practices may vary based on your use, region, and age. The developer provided this information and may update it over time.

No data shared with third parties
Learn more about how developers declare sharing

No data collected
Learn more about how developers declare collection
Ratings and reviews
2.3
2.38K reviews

Rm Wntz
- Flag inappropriate
December 3, 2023
App very basic, not really real time, it is refreshed every 10 min or so? It could be nice if it was under or = to 1min. As a French, we are equipped with Linky smart meter, which communicate the consumption on hourly/month/annual basis, it would be nice to be able to correlate those information into your app. Also, I noticed that the meter installed on my photovoltaic installation is giving me less Kwh produced than what your app is showing.
2 people found this review helpful

Gary Rauls
- Flag inappropriate
December 24, 2025
My app worked pretty well for a year and a half until December the 9th or 10th of 2025. customer support keep sending me information on how to reconnect but nothing woríks. when I get someone on the phone I'm told that I have an open case and it will be resolved. I am not happy at all. very poor customer service indeed. I should be able to get someone to talk to me on the phone and tell me how to use or reconnect their device.
3 people found this review helpful

David Hunter
- Flag inappropriate
December 16, 2025
Stopped reporting all info in early October after 7 years and still not working. The panels however seem to be working fine according to the separate Rainforest monitor I have that shows real-time level of total solar panel output.
1 person found this review helpful
What’s new
Fix some bugs.
App support
phone
Phone number
+18446667035
About the developer
Altenergy Power Systems USA Inc
support.usa@apsystems.com
8627 N Mopac Expy Ste 150
Austin, TX 78759
United States
+1 844-279-8600


