Physics Toolbox Sensor Suite
Contains adsIn-app purchases

4.7star
19.8K reviews
1M+
Downloads

Everyone
info


About this app
Turn your phone into a powerful sensor lab. This app uses your smartphone’s built-in sensors to collect, display, record, and export CSV data for analysis. Ideal for physics, engineering, and STEM experiments in classrooms, labs, and fieldwork.
Visit www.vieyrasoftware.net to explore case studies and lesson plans for educators and researchers.
⸻
KINEMATICS
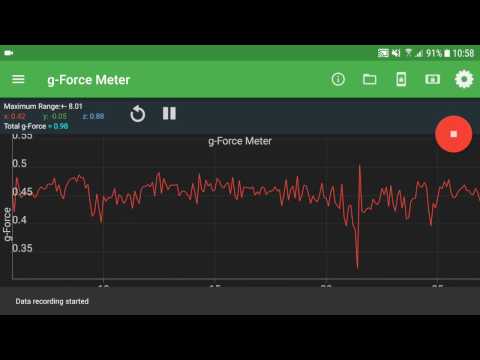
• G-Force Meter: Ratio of Fn/Fg (x, y, z, and/or total)
• Linear Accelerometer: Acceleration in x, y, z axes
• Gyroscope: Radial velocity (x, y, z)
• Inclinometer: Azimuth, roll, pitch
• Protractor: Angle from vertical or horizontal
ACOUSTICS
• Sound Meter: Sound intensity
• Tone Detector: Frequency and musical tone
• Tone Generator: Sound frequency output
• Oscilloscope: Wave shape and amplitude
• Spectrum Analyzer: Graphical FFT
• Spectrogram: Waterfall FFT
LIGHT
• Light Meter: Light intensity
• Color Detector: HEX color detection via camera
• Color Generator: R/G/B/Y/C/M, white, and custom colors
• Proximeter: Periodic motion and timer (timer and pendulum modes)
• Stroboscope (beta): Flash-based frequency visualization
• Wi-Fi: Signal strength monitoring
MAGNETISM
• Compass: Magnetic direction and bubble level
• Magnetometer: Magnetic field intensity (x, y, z, and/or total)
• Magna-AR: Augmented-reality magnetic vector visualization
OTHER
• Barometer: Atmospheric pressure
• Ruler: Distance measurement between two points
• GPS: Latitude, longitude, altitude, speed, direction, and satellites
• System Temperature: Battery temperature
COMBINATION
• Multi Record: Collect data from multiple sensors at once
• Dual Sensor: Display two sensor graphs in real time
• Roller Coaster Mode: Combine G-Force, Accelerometer, Gyroscope, and Barometer
PLOTTING
• Manual Data Plot: Create graphs from manually entered data
GAME
• Play Mode: Physics challenges using real sensor input
FEATURES
• Record: Capture sensor data with one tap
• Export: Save recordings as CSV data for analysis or sharing
• Sensor Info: Learn sensor name, vendor, operating principle, and precision
SETTINGS
• Custom Sample Rate: Adjust data collection speed manually
• Filters: Apply low-pass, mean average, or Kalman filters to smooth data
• Data Display: View results as graphs, vectors, or digital readings
• Graph Display: Choose combined or separate plots for multi-axis data
• Axis Selection: Display total, x, y, and/or z data
• Timestamp Format: Record clock or elapsed time
• Line Width: Customize line thickness for graphs
• Keep Screen On: Prevent automatic sleep during experiments
• Calibration: Calibrate sensors for accuracy
Perfect for:
Physics experiments, classroom demonstrations, motion analysis, sound testing, light and color measurement, magnetic field mapping, and environmental data collection.
Visit www.vieyrasoftware.net to explore case studies and lesson plans for educators and researchers.
⸻
KINEMATICS
• G-Force Meter: Ratio of Fn/Fg (x, y, z, and/or total)
• Linear Accelerometer: Acceleration in x, y, z axes
• Gyroscope: Radial velocity (x, y, z)
• Inclinometer: Azimuth, roll, pitch
• Protractor: Angle from vertical or horizontal
ACOUSTICS
• Sound Meter: Sound intensity
• Tone Detector: Frequency and musical tone
• Tone Generator: Sound frequency output
• Oscilloscope: Wave shape and amplitude
• Spectrum Analyzer: Graphical FFT
• Spectrogram: Waterfall FFT
LIGHT
• Light Meter: Light intensity
• Color Detector: HEX color detection via camera
• Color Generator: R/G/B/Y/C/M, white, and custom colors
• Proximeter: Periodic motion and timer (timer and pendulum modes)
• Stroboscope (beta): Flash-based frequency visualization
• Wi-Fi: Signal strength monitoring
MAGNETISM
• Compass: Magnetic direction and bubble level
• Magnetometer: Magnetic field intensity (x, y, z, and/or total)
• Magna-AR: Augmented-reality magnetic vector visualization
OTHER
• Barometer: Atmospheric pressure
• Ruler: Distance measurement between two points
• GPS: Latitude, longitude, altitude, speed, direction, and satellites
• System Temperature: Battery temperature
COMBINATION
• Multi Record: Collect data from multiple sensors at once
• Dual Sensor: Display two sensor graphs in real time
• Roller Coaster Mode: Combine G-Force, Accelerometer, Gyroscope, and Barometer
PLOTTING
• Manual Data Plot: Create graphs from manually entered data
GAME
• Play Mode: Physics challenges using real sensor input
FEATURES
• Record: Capture sensor data with one tap
• Export: Save recordings as CSV data for analysis or sharing
• Sensor Info: Learn sensor name, vendor, operating principle, and precision
SETTINGS
• Custom Sample Rate: Adjust data collection speed manually
• Filters: Apply low-pass, mean average, or Kalman filters to smooth data
• Data Display: View results as graphs, vectors, or digital readings
• Graph Display: Choose combined or separate plots for multi-axis data
• Axis Selection: Display total, x, y, and/or z data
• Timestamp Format: Record clock or elapsed time
• Line Width: Customize line thickness for graphs
• Keep Screen On: Prevent automatic sleep during experiments
• Calibration: Calibrate sensors for accuracy
Perfect for:
Physics experiments, classroom demonstrations, motion analysis, sound testing, light and color measurement, magnetic field mapping, and environmental data collection.
Updated on
Safety starts with understanding how developers collect and share your data. Data privacy and security practices may vary based on your use, region, and age. The developer provided this information and may update it over time.

No data shared with third parties
Learn more about how developers declare sharing

This app may collect these data types
App activity and App info and performance

Data is encrypted in transit

Data can’t be deleted
Ratings and reviews
4.7
19.2K reviews

Raymond B
- Flag inappropriate
- Show review history
November 28, 2025
Paid for this program many years ago and I'm a little disappointed that I'm not grandfathered into physics toolbox plus. I suppose it's not really that big of a deal now that this program really isn't that all that unique these days seeing as there are many many open source alternatives, It was interesting while it lasted at least... I wish the developers the best but this has left a bit of a negative impression on me unfortunately...
1 person found this review helpful

Pete Andrew
- Flag inappropriate
September 26, 2025
I've used this app on every phone I've owned for the last decade. It's always been reliable. Now it suddenly changed and the graphs are so small that they are pointless. I can't do anything to change the size and if I flip it to landscape mode, the graph disappears entirely. I uninstalled, then reinstalled, cleared the cash and changed every display setting on my phone, with no luck. Please fix it.
3 people found this review helpful
Vieyra Software
October 7, 2025
Hi, the newest version has a button to make all graphs full screen. Please be sure to update to the newest version! If you have additional feedback, please write to us at support@vieyrasoftware.net

C C
- Flag inappropriate
- Show review history
August 3, 2025
bought to play around with the acoustical tools, really disappointed when I realized I couldn't save any spectrogram or spectrum analyzer data. wish I could get a refund edit: I did get a refund. but in general, even if it wasn't an advertised feature, it's a little silly to have a tool that lets you see data but not collect it.
2 people found this review helpful
Vieyra Software
August 3, 2025
Hi, sorry to hear about the disappointment. The Pro version doesn't advertise that as a feature. You should be able to ask for a refund on Google Play. If you want to suggest this as a feature, please provide some more detail and write to us at support@vieyrasoftware.net
What’s new
Updated the load file mode
Fixed visual issues on devices that use the 3 button navigation
Fixed visual issues on devices that use the 3 button navigation
App support
About the developer
Chrystian Vieyra Cortes
support@vieyrasoftware.net
310 3rd St SE #2
Washington, DC 20003-1905
United States


