
ProfiSignal 20
50+
Yuklanmalar

Hamma uchun
info


Bu ilova haqida
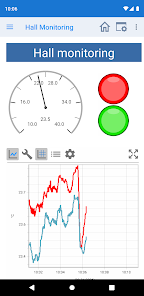
ProfiSignal 20 is a platform independent software for measurement data analysis and process monitoring. Using the ProfiSignal 20 App you can visualize and analyze your measurement data and monitor and control your processes regardless of your location.
Key Features:
• Measurement data monitoring and analysis from different sources (hardware and software)
• From measurement data to a chart visualization in only three steps using ProfiSignal Go
• System and process visualization without any programming effort using ProfiSignal Basic
• The Innovative SCACH-Feature opens your charts and projects via a simple QR-code scan
• y(t)-diagrams with one or multiple axes for simultaneous visualization and analysis of different measurement values
• Analyze multiple measurement curves sharing a single time axis using the Multitrack Chart
• Powerful visualization of measurement data with fast, seamless transition between live and historical data
• A wide range of displays and controls for creating individual process dashboards
• Adjust your projects while in runtime using the working copy concept
• Design and reuse frequently used object combinations with the Object Designer
Oxirgi yangilanish
Xavfsizlik — dastur ishlab chiquvchilar maʼlumotlaringizni qanday jamlashi va ulashishini tushunishdan boshlanadi. Maʼlumotlar maxfiyligi va xavfsizlik amaliyotlari ilovadan foydalanish, hudud va yoshga qarab farq qilishi mumkin. Bu axborot dastur ishlab chiquvchi tomonidan taqdim etilgan va keyinchalik yangilanishi mumkin.

Tashqi hamkorlarga hech qanday axborot ulashilmagan
Dastur ishlab chiquvchilar axborot ulashilishini qanday aytishi haqida batafsil

Ushbu ilova quyidagi axborot turlarini toʻplashi mumkin
Men haqimda, Suratlar va videolar va yana 4 ta

Maʼlumotlar shifrlanmagan
Maʼlumotlar oʻchmaydi
Nima yangiliklar
- It is now possible to use video feeds in Basic projects.
- We have introduced autoscaling of the relative time axis in charts.
- A button has been added to the chart toolbar to reload chart data.
- The project title is now automatically used as the chart headline.
- All project channels are now added to the temporary storage.
- The logic chart has been added to the list of charts.
- Bug fixes and various other improvements.
Ilova yuzasidan yordam
Dasturchi haqida
Delphin Technology AG
info@delphin.de
Lustheide 81
51427 Bergisch Gladbach
Germany
+49 160 96696110


