Metrics and Graphs - Tracker
Contains adsIn-app purchases
4.0star
103 reviews
5K+
Downloads

Everyone
info


About this app
Transform your daily routines into powerful visualizations
Metrics and Graphs is your ultimate Tracker for your Activities, Data, Habits, or Goals. Acting as a comprehensive journal, it enables you to Record, Track, Monitor, and Analyse your data, providing integrated statistics. Track measurements about health, finances, gardening, activities, and any other metric or event that comes to your mind!
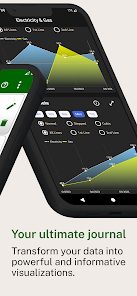
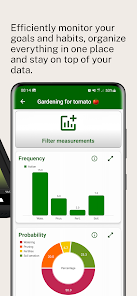
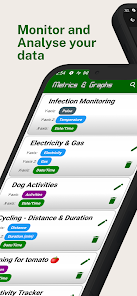
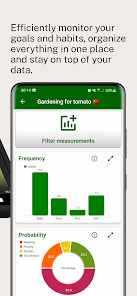
Efficiently monitor your data, goals and habits, organize everything in one place and stay on top of your data with ease.
📊 Graphs & Charts
Metrics and Graphs enables you to transform your data into powerful and informative visualizations that make it easy to understand your progress and identify patterns.
Use filters, group your data and view your progress in dynamic graphs, charts, histograms and other types of visualizations. Gain valuable insights into your behavior and make informed decisions.
Create visually appealing and informative graphs and charts with Metrics and Graphs, such as:
- Line Charts
- Bar Charts
- Histograms
- Pie Charts
📈 Statistics, Data Analysis and Visualization Features
Our app covers a wide range of statistics, data analysis and features, including:
- Frequency
- Probability
- Longest streak
- Shortest streak
- Timeline
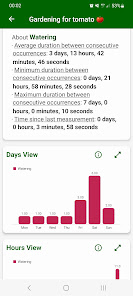
- X-Axis statistics like Average/Max/Min duration
- Accumulate
- Difference
- And much more!
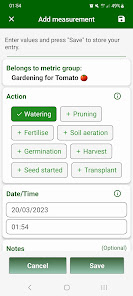
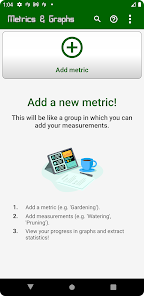
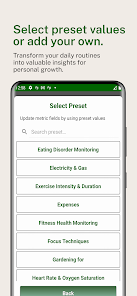
⚙️ Presets
Our app offers a large collection of metric presets that can help you quickly create and track metrics about Mood, Gardening, Work, Health, Activities and many more.
Additionally, metric presets can provide inspiration for new ideas that fit your needs, making it even easier to monitor your progress.
💾 Save/Export data to Excel
Export your data to an Excel file for free.
This feature enables you to have a copy of your data in a universally compatible and widely used format. You can share this file, process it on a PC, analyze trends, and create visual reports. Experience the freedom of handling your data your way!
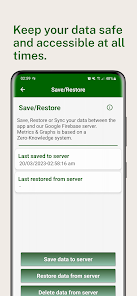
💾 Save/Restore - Server
Keep your data safe and accessible at all times.
You can manually Save\Restore\Sync\Delete your data between any Android device and our Google Firebase server.
Your data will be encrypted during transmission and storage.
Metrics and Graphs is your ultimate Tracker for your Activities, Data, Habits, or Goals. Acting as a comprehensive journal, it enables you to Record, Track, Monitor, and Analyse your data, providing integrated statistics. Track measurements about health, finances, gardening, activities, and any other metric or event that comes to your mind!
Efficiently monitor your data, goals and habits, organize everything in one place and stay on top of your data with ease.
📊 Graphs & Charts
Metrics and Graphs enables you to transform your data into powerful and informative visualizations that make it easy to understand your progress and identify patterns.
Use filters, group your data and view your progress in dynamic graphs, charts, histograms and other types of visualizations. Gain valuable insights into your behavior and make informed decisions.
Create visually appealing and informative graphs and charts with Metrics and Graphs, such as:
- Line Charts
- Bar Charts
- Histograms
- Pie Charts
📈 Statistics, Data Analysis and Visualization Features
Our app covers a wide range of statistics, data analysis and features, including:
- Frequency
- Probability
- Longest streak
- Shortest streak
- Timeline
- X-Axis statistics like Average/Max/Min duration
- Accumulate
- Difference
- And much more!
⚙️ Presets
Our app offers a large collection of metric presets that can help you quickly create and track metrics about Mood, Gardening, Work, Health, Activities and many more.
Additionally, metric presets can provide inspiration for new ideas that fit your needs, making it even easier to monitor your progress.
💾 Save/Export data to Excel
Export your data to an Excel file for free.
This feature enables you to have a copy of your data in a universally compatible and widely used format. You can share this file, process it on a PC, analyze trends, and create visual reports. Experience the freedom of handling your data your way!
💾 Save/Restore - Server
Keep your data safe and accessible at all times.
You can manually Save\Restore\Sync\Delete your data between any Android device and our Google Firebase server.
Your data will be encrypted during transmission and storage.
Updated on
Safety starts with understanding how developers collect and share your data. Data privacy and security practices may vary based on your use, region, and age. The developer provided this information and may update it over time.

No data shared with third parties
Learn more about how developers declare sharing

This app may collect these data types
App activity and App info and performance

Data is encrypted in transit

Data can’t be deleted
Ratings and reviews
4.0
98 reviews

Mary Harger
- Flag inappropriate
April 12, 2025
good app except it could use a grouping feature where your able to create a file and name it to store different sets of data. I'm currently using this to track exercises but in the future I would like to track other things but as of now everything would all be clumped together in the same long scroll menu because my exercise already take up a decent bit of scroll space.
1 person found this review helpful

Katie Guye
- Flag inappropriate
June 17, 2023
A nice, intuitive tracker app. The interface reminds me of an old 2010 app, but I don't mind simplicity that works! I'm not sure if I'll be able to keep using it due to the inability to export data. And visually, it would be nice if there was a compact table view of the log. But overall a decent tracker!
3 people found this review helpful
GVK Software
July 10, 2023
Hi Katie,
Thanks for your feedback! We've just added a new free "Export/Save to Excel" feature for easy data backup. Also, new charts have been introduced for better visualisation. Please don’t hesitate to get in touch with us at info@gvksoftware.co.uk with any suggestions. Thank you for your support!

Daniel
- Flag inappropriate
September 24, 2023
The app specifically lists pie charts. This is a lie or they made it really complicated to find. Not user friendly at all. But for a weird reasons it has loads of options, like blood glucose. And all it does is add a title and description and not change the metrics. Such a weird choice for developers. Like, we can add that ourselves. Give us real options. Like making a pie chart.
26 people found this review helpful
GVK Software
September 25, 2023
Thank you for your feedback. Our app is designed to be highly configurable so you can track and visualize a wide range of metrics, beyond just health data. While pie charts are available, some data cannot be represented by a pie chart by nature. In any case you have the option to export your data for free to an Excel file for further customization.
What’s new
Current release:
- Minor updates
Previous releases:
- Negative Days/Hours view charts
- Hide/Show Graphs option
- Dark/Auto Mode
- Save to Excel
- Day/Hour Frequency Charts
- Calendar Heatmap Chart
- Parameter-Value Chart
- Hours Chart
- Days Chart
- Group based on Average or Sum
- Combine measurements.
- Second measurement type field.
- New Presets
- More statistics added
App support
About the developer
GVK Software
info@gvksoftware.co.uk
7 JUPITER HEIGHTS
UXBRIDGE
UB10 0TA
United Kingdom
+44 7474 308724


