
My Global Stocks


Everyone
info
5+
Downloads

Everyone
Learn more


About this app
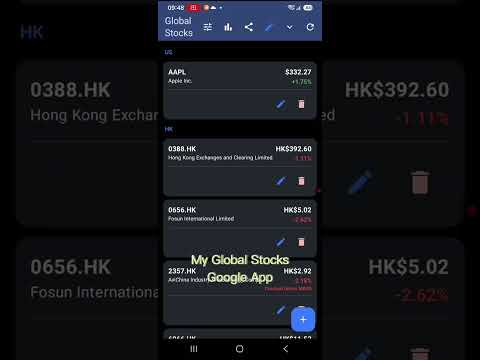
Global Stocks is a portfolio tracking and stock analysis app for investors who want a clearer view of their holdings and trading ideas.
Track your stocks with cost information, aliases, profit and loss, and support for holdings in multiple currencies. Import an existing portfolio from CSV, validate symbols, and keep your data organized.
Explore interactive price charts and adjust technical analysis settings such as moving averages, moving-average bands, and period highs. Review key company fundamentals, including P/E, P/B, EV/EBITDA, debt-to-equity, ROE, free cash flow, growth rates, and dividend yield, with explanations of the underlying metrics.
Test historical strategies with built-in backtesting tools, including:
Buy and hold
Moving-average crossover
Moving-average crossover with stop loss
Dual moving-average strategies, such as 5/20, 20/50, and 50/200
Compare results across different historical periods, review individual trades, and export backtest reports for later reference. You can also save and share portfolio snapshots to compare your holdings over time.
Global Stocks is designed for personal research and portfolio tracking. It does not provide investment advice, execute trades, or guarantee future results. Market data and fundamentals are sourced from Yahoo Finance and may be delayed or unavailable. An internet connection is required for current data.
Track your stocks with cost information, aliases, profit and loss, and support for holdings in multiple currencies. Import an existing portfolio from CSV, validate symbols, and keep your data organized.
Explore interactive price charts and adjust technical analysis settings such as moving averages, moving-average bands, and period highs. Review key company fundamentals, including P/E, P/B, EV/EBITDA, debt-to-equity, ROE, free cash flow, growth rates, and dividend yield, with explanations of the underlying metrics.
Test historical strategies with built-in backtesting tools, including:
Buy and hold
Moving-average crossover
Moving-average crossover with stop loss
Dual moving-average strategies, such as 5/20, 20/50, and 50/200
Compare results across different historical periods, review individual trades, and export backtest reports for later reference. You can also save and share portfolio snapshots to compare your holdings over time.
Global Stocks is designed for personal research and portfolio tracking. It does not provide investment advice, execute trades, or guarantee future results. Market data and fundamentals are sourced from Yahoo Finance and may be delayed or unavailable. An internet connection is required for current data.
Track stocks, analyze trends, and backtest strategies for your portfolio.
Updated on
Safety starts with understanding how developers collect and share your data. Data privacy and security practices may vary based on your use, region, and age. The developer provided this information and may update it over time.
- No data shared with third partiesLearn more about how developers declare sharing
- No data collectedLearn more about how developers declare collection


What’s new
1. Adds the 4th dual moving-average crossover strategy to backtesting, using common MA pairs such as 5/20, 20/50, and 50/200
2. The chart adapts to screen orientation, showing 60 days in portrait and approximately one year in landscape.
3. Backtest results can be exported as a text report or shared as a PNG image, including the chart, indicators, trades, and date range.
2. The chart adapts to screen orientation, showing 60 days in portrait and approximately one year in landscape.
3. Backtest results can be exported as a text report or shared as a PNG image, including the chart, indicators, trades, and date range.


