Blood Test Grapher
Contains adsIn-app purchases
3.4star
142 reviews
10K+
Downloads

Everyone
info


About this app
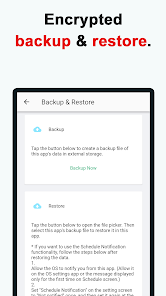
・Encrypted backup & restore functionality is available.
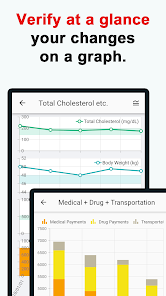
・Verify at a glance your test results and diet changes on a graph.
・Record and graph your own data items!
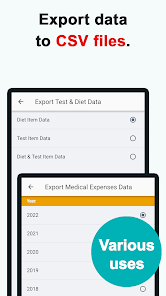
・CSV file export functionality.
・Data migration functionality from iOS app.
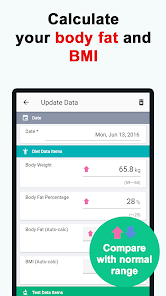
・Calculate your body fat (kg/lb) and BMI automatically.
・Record numerical values in one go using one single screen.
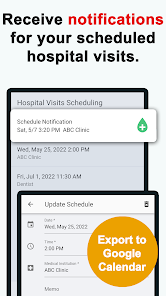
・Receive notifications for your scheduled hospital visits.
・Execute quick operations offline.
・Dark theme is available.
§Recorded Data Items
The following data items are recorded by default. (Any of the default data items can be hidden.)
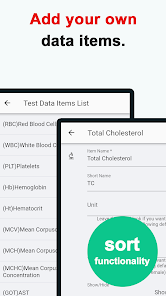
Apart from these data items, you can also record and sort your own data items!
Diet Data Items:
- Body Weight
- Body Fat Percentage
- Body Fat (Auto-calc)
- BMI (Auto-calc)
- Running *
- Walking *
- Calories (Taken) *
- Calories (Burned) *
Test Data Items:
- Red Blood Cells (RBC)
- White Blood Cells (WBC)
- Platelets (PLT)
- Hemoglobin (Hb)
- Hematocrit (Ht)
- Mean Corpuscular Volume (MCV)
- Mean Corpuscular Hemoglobin (MCH)
- Mean Corpuscular Hemoglobin Concentration (MCHC)
- AST (GOT)
- ALT (GPT)
- Gamma GTP
- Total Protein (TP)
- Albumin (ALB)
- Total Cholesterol (TC)
- HDL Cholesterol (HDL-C)
- LDL Cholesterol (LDL-C)
- Triglyceride (TG)
- Hemoglobin A1c (HbA1c) *
- Blood Sugar (FPG) *
*: Data items initially set as hidden.
§Hospital Visits Scheduling Screen
By recording the medical institutions you are due to visit, as well as the date and time of your appointments, you can configure the app to send you notifications at a specified time.
The time of the notifications can be changed in the Settings screen.
§Data Records Screen
This screen records the numerical values related to your diet and test results.
Configuration changes for adding new input data items, etc. can be made from the "Diet Data Items List" or "Test Data Items List" on the Settings screen.
§Graph Screen
This screen allows you to verify the numerical data recorded on the Data Records screen by plotting it on a graph.
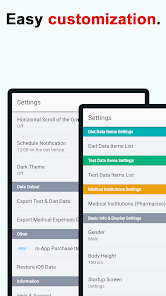
§Settings Screen
This screen allows you to configure basic information, display settings, record master data, etc.
Please set your "Gender" and "Height". These values will be used for calculating the normal range of your test data items and your BMI.
§Privacy Policy
See the link below.
https://btgraphapp.blogspot.com/p/privacy-policy.html
・Verify at a glance your test results and diet changes on a graph.
・Record and graph your own data items!
・CSV file export functionality.
・Data migration functionality from iOS app.
・Calculate your body fat (kg/lb) and BMI automatically.
・Record numerical values in one go using one single screen.
・Receive notifications for your scheduled hospital visits.
・Execute quick operations offline.
・Dark theme is available.
§Recorded Data Items
The following data items are recorded by default. (Any of the default data items can be hidden.)
Apart from these data items, you can also record and sort your own data items!
Diet Data Items:
- Body Weight
- Body Fat Percentage
- Body Fat (Auto-calc)
- BMI (Auto-calc)
- Running *
- Walking *
- Calories (Taken) *
- Calories (Burned) *
Test Data Items:
- Red Blood Cells (RBC)
- White Blood Cells (WBC)
- Platelets (PLT)
- Hemoglobin (Hb)
- Hematocrit (Ht)
- Mean Corpuscular Volume (MCV)
- Mean Corpuscular Hemoglobin (MCH)
- Mean Corpuscular Hemoglobin Concentration (MCHC)
- AST (GOT)
- ALT (GPT)
- Gamma GTP
- Total Protein (TP)
- Albumin (ALB)
- Total Cholesterol (TC)
- HDL Cholesterol (HDL-C)
- LDL Cholesterol (LDL-C)
- Triglyceride (TG)
- Hemoglobin A1c (HbA1c) *
- Blood Sugar (FPG) *
*: Data items initially set as hidden.
§Hospital Visits Scheduling Screen
By recording the medical institutions you are due to visit, as well as the date and time of your appointments, you can configure the app to send you notifications at a specified time.
The time of the notifications can be changed in the Settings screen.
§Data Records Screen
This screen records the numerical values related to your diet and test results.
Configuration changes for adding new input data items, etc. can be made from the "Diet Data Items List" or "Test Data Items List" on the Settings screen.
§Graph Screen
This screen allows you to verify the numerical data recorded on the Data Records screen by plotting it on a graph.
§Settings Screen
This screen allows you to configure basic information, display settings, record master data, etc.
Please set your "Gender" and "Height". These values will be used for calculating the normal range of your test data items and your BMI.
§Privacy Policy
See the link below.
https://btgraphapp.blogspot.com/p/privacy-policy.html
Updated on
Safety starts with understanding how developers collect and share your data. Data privacy and security practices may vary based on your use, region, and age. The developer provided this information and may update it over time.

This app may share these data types with third parties
Location, App activity and 2 others

No data collected
Learn more about how developers declare collection

Data is encrypted in transit

Data can’t be deleted
Ratings and reviews
3.4
137 reviews

Luis Aranguren
- Flag inappropriate
July 18, 2023
I love this app. Being able to keep track of all your tests and graph them is so visually valuable. Several times have effectively shared data with doctors that way. If you could only just take a screenshot of the test page and the app could populate the data for you. But I can dream.
2 people found this review helpful

Rabindra N Das
- Flag inappropriate
September 19, 2023
It is good app to record blood test data. We may add some other parameters also like BP. But I don't know how to draw graph for two or more parameters like Blood Sugar and HB A1c.
AI imai
October 17, 2023
thank you for your review. i'm not sure the meaning of "two or more parameters", but somehow "multi-graph mode" might help you. take care!

Tanzeel Gilani
- Flag inappropriate
December 9, 2024
Useful app, Would have been nice if I was able to add all data point on the same graph rather than individual graph of each data attribute.
What’s new
- Minor fixes.
App support
About the developer
ai imai
eyesappli@gmail.com
2-4-3 Higashiikebukuro
Toshima, 東京都 170-0013
Japan


