
Charts & Stock Market Analysis
Contains adsIn-app purchases

4.5star
383 reviews
50K+
Downloads

Everyone
info


About this app
Statmetrics is a comprehensive solution for stock market analysis, portfolio tracking and analytics, investment management and research. Stay on top of the markets and access global market news, economic and real-time financial data from global stock exchanges. Forecast market trends and cycles with advanced charting and technical analysis. Construct, backtest and manage multiple portfolios and streamline your risk management with the integrated portfolio analytics solution. Analyze the fundamental and quantitative characteristics of portfolio or potential investments and gain insight into the risk-return profile of your investments. Track overall performance of your portfolio across all accounts in one place and evaluate your investment strategy. Enhance your investment research, explore investment opportunities and identify hidden risks that affect your investments with a comprehensive suite of analytical tools and financial models.
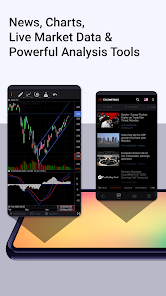
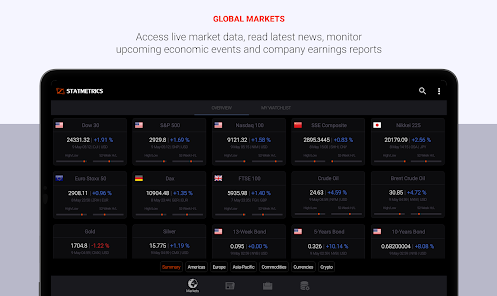
GLOBAL MARKETS & FINANCIAL NEWS
- Live quotes and charts for major financial instruments (indices, stocks, bonds, mutual funds, ETFs, commodities, currencies, crypto, interest rates, futures and options), traded on global exchanges.
- Market screener for searching equities, funds and ETFs by user-defined search parameters.
- Personalized watchlists and notepad for storing trading ideas.
- Calendar for economic events and company earnings reports.
- Financial news coverage for multiple regions and languages
- Integrated RSS-Reader and news feed subscription by the user.
- Search for news headlines and Google Trends statistics by specific keywords.
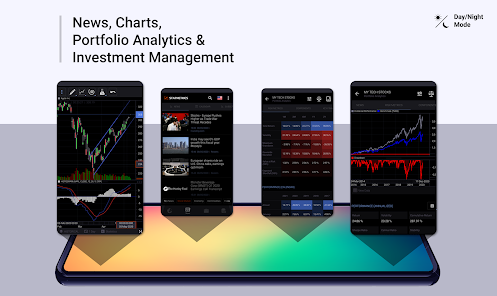
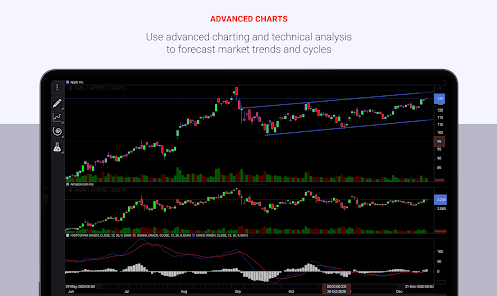
CHARTING & TECHNICAL ANALYSIS
- Interactive high-performance charting and broad range of drawing tools.
- Large set of commonly used technical indicators.
- Custom Templates for intraday and historical charts.
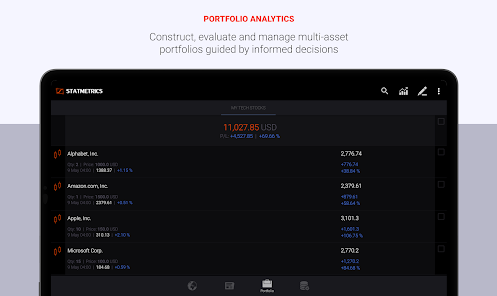
PORTFOLIO MANAGEMENT
- Real-time tracking of multiple investment portfolios
- Transaction management of securities and other assets, withdrawals and deposits, dividends, income and expenses, corporate actions
- Cash flow management for monitoring cash inflows/outflows and analyzing income generation
- Multi-account management for asset, security and cash accounts with multi-currency support
- Historical portfolio performance analysis with Compound Annual Growth Rate (CAGR), Money-Weighted Return (MWR) or Internal Rate of Return (IRR).
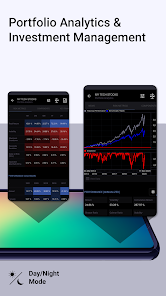
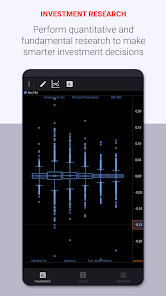
PORTFOLIO ANALYTICS & INVESTMENT RESEARCH
- Portfolio performance tracking and analysis of investment strategies based on trading history
- Construction, backtesting and management of multi-currency and long-short portfolios.
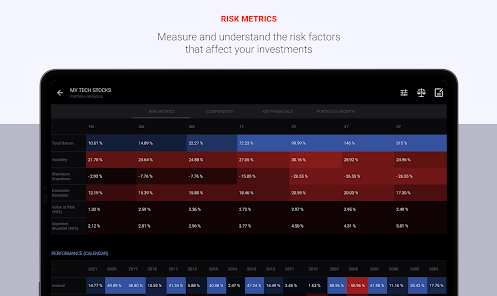
- Fundamental and quantitative performance and risk analysis of portfolio and its components.
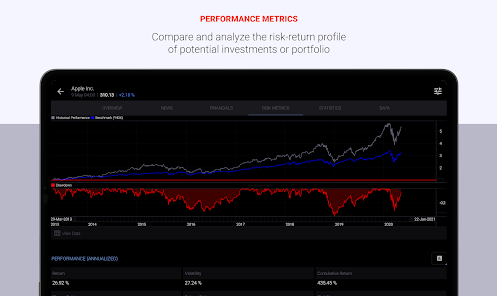
- Measuring performance vs. benchmark and calculation of investment risk indicators (return, volatility, Sharpe ratio, maximum drawdown, value-at-risk, expected shortfall, alpha, beta, information ratio, etc.).
- Analysis of stress events, drawdowns and measuring of historical and modified value-at-risk.
- Evaluation of asset allocation, sector allocation, correlations and portfolio risk decomposition.
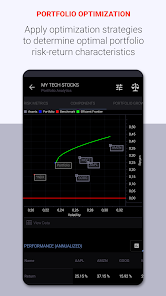
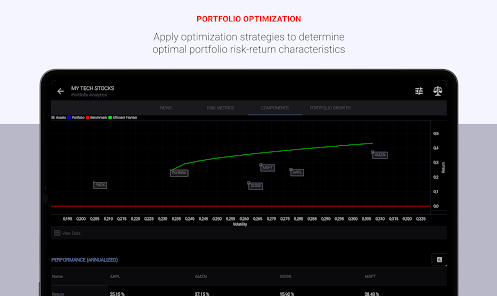
- Visualization of security market line, security characteristic line, efficient frontier and rolling investment risk indicators.
- Predefined mean-variance portfolio optimization strategies (minimum variance, maximum diversification, maximum decorrelation, equal risk contribution, etc.).
- Fundamental analysis of income statement, balance sheet, cash-flow statement, institutional holders, mutual fund holders, company profiles and visualization of key financial ratios.
- Evaluation of fundamental factors such as per share data, valuation ratios, profitability, growth, leverage, liquidity, dividend growth and dividend history.
- Calculation of group descriptive statistics for single assets, portfolio or a watchlist.
- Statistical visualization and hypothesis testing (unit root test, Granger causality test, etc.).
- Correlation, cointegration, regression and principal component analysis.
GLOBAL MARKETS & FINANCIAL NEWS
- Live quotes and charts for major financial instruments (indices, stocks, bonds, mutual funds, ETFs, commodities, currencies, crypto, interest rates, futures and options), traded on global exchanges.
- Market screener for searching equities, funds and ETFs by user-defined search parameters.
- Personalized watchlists and notepad for storing trading ideas.
- Calendar for economic events and company earnings reports.
- Financial news coverage for multiple regions and languages
- Integrated RSS-Reader and news feed subscription by the user.
- Search for news headlines and Google Trends statistics by specific keywords.
CHARTING & TECHNICAL ANALYSIS
- Interactive high-performance charting and broad range of drawing tools.
- Large set of commonly used technical indicators.
- Custom Templates for intraday and historical charts.
PORTFOLIO MANAGEMENT
- Real-time tracking of multiple investment portfolios
- Transaction management of securities and other assets, withdrawals and deposits, dividends, income and expenses, corporate actions
- Cash flow management for monitoring cash inflows/outflows and analyzing income generation
- Multi-account management for asset, security and cash accounts with multi-currency support
- Historical portfolio performance analysis with Compound Annual Growth Rate (CAGR), Money-Weighted Return (MWR) or Internal Rate of Return (IRR).
PORTFOLIO ANALYTICS & INVESTMENT RESEARCH
- Portfolio performance tracking and analysis of investment strategies based on trading history
- Construction, backtesting and management of multi-currency and long-short portfolios.
- Fundamental and quantitative performance and risk analysis of portfolio and its components.
- Measuring performance vs. benchmark and calculation of investment risk indicators (return, volatility, Sharpe ratio, maximum drawdown, value-at-risk, expected shortfall, alpha, beta, information ratio, etc.).
- Analysis of stress events, drawdowns and measuring of historical and modified value-at-risk.
- Evaluation of asset allocation, sector allocation, correlations and portfolio risk decomposition.
- Visualization of security market line, security characteristic line, efficient frontier and rolling investment risk indicators.
- Predefined mean-variance portfolio optimization strategies (minimum variance, maximum diversification, maximum decorrelation, equal risk contribution, etc.).
- Fundamental analysis of income statement, balance sheet, cash-flow statement, institutional holders, mutual fund holders, company profiles and visualization of key financial ratios.
- Evaluation of fundamental factors such as per share data, valuation ratios, profitability, growth, leverage, liquidity, dividend growth and dividend history.
- Calculation of group descriptive statistics for single assets, portfolio or a watchlist.
- Statistical visualization and hypothesis testing (unit root test, Granger causality test, etc.).
- Correlation, cointegration, regression and principal component analysis.
Updated on
Safety starts with understanding how developers collect and share your data. Data privacy and security practices may vary based on your use, region, and age. The developer provided this information and may update it over time.


Ratings and reviews
4.5
354 reviews

Mike Dixon
- Flag inappropriate
- Show review history
August 29, 2023
August 2023 update: Dropped to 4 stars because I can't find any way to set alerts. As far as I can tell, this feature doesn't exist. Still great. This is the app I settled on as a Webull replacement, and after testing 20+ apps in a week I am on their paid monthly service. It is extremely feature-rich, with surprisingly powerful analysis tools and useful features. Example: it can automatically add stock events (splits, dividends, etc) and flag them for your review so you don't get false events.
19 people found this review helpful

Dr Tim Pearce
- Flag inappropriate
- Show review history
May 26, 2022
Excellent app. No problem finding all the symbols to add to a portfolio. Excellent range of portfolio calculations and graphics close to full professional portfolio analyser. Suggestion could be to give the option to make portfolios public with the analysis. Update May 22: I have some strange behaviour on portfolios including entire portfolio deleted without warning. Good idea to backup. Will update when it's fixed.
13 people found this review helpful

Bob K
- Flag inappropriate
May 13, 2021
Thanks for developing the app.The pricing and the analysis for the stocks are great. I am to going to sound like a complete idiot, but, could you some how include basic risk management, say position sizing and exit/entry triggers based on position... Super elementary but very helpful. Also, please make a desktop widget with positions, riskz etc. Thanks again!
11 people found this review helpful
Statmetrics
May 13, 2021
Hi Bob,
Thanks for the feedback, I will add a position size calculator and a desktop widget to my ToDo list. A reliable notification for exit/entry and price alerts requires a complex IT infrastructure (because Android closes all background running app's in sleep mode), which we currently don't have.
Best regards, Alex.
What’s new
- UX Improvements
App support
About the developer
Alexej Vinnitschenko
app@statmetrics.org
Elsterstraße 43
04109 Leipzig
Germany
undefined


